Fig. 2
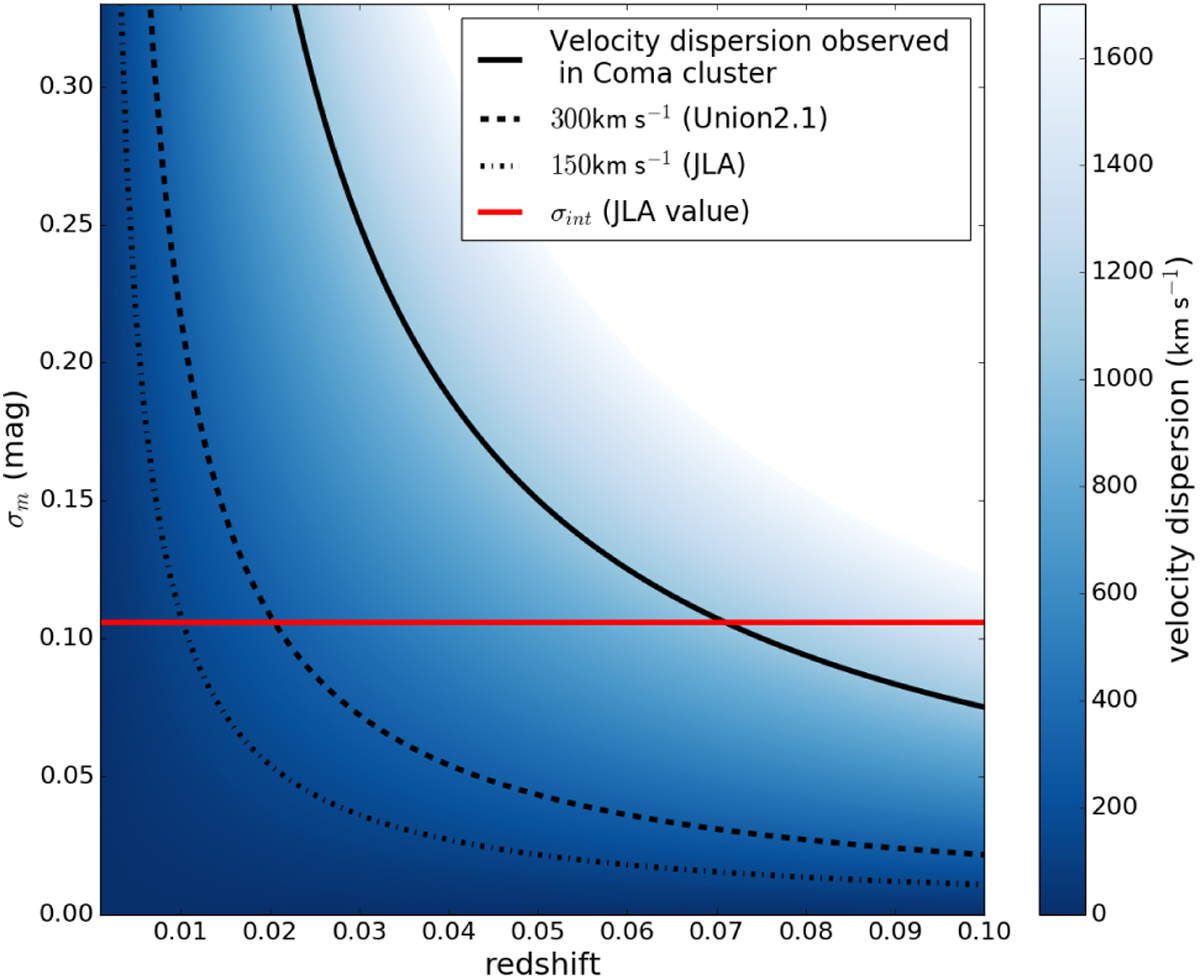
Redshift uncertainties (in magnitude units) due to different levels of peculiar velocities as a function of the cosmological redshift. The solid black line corresponds to the Coma cluster velocity dispersion; the dashed and dash-dotted lines correspond to 300 and 150 km s−1, respectively. The red line shows the intrinsic dispersion of SNe Ia on the Hubble diagram found for the JLA sample (Betoule et al. 2014).
Current usage metrics show cumulative count of Article Views (full-text article views including HTML views, PDF and ePub downloads, according to the available data) and Abstracts Views on Vision4Press platform.
Data correspond to usage on the plateform after 2015. The current usage metrics is available 48-96 hours after online publication and is updated daily on week days.
Initial download of the metrics may take a while.