Fig. 10
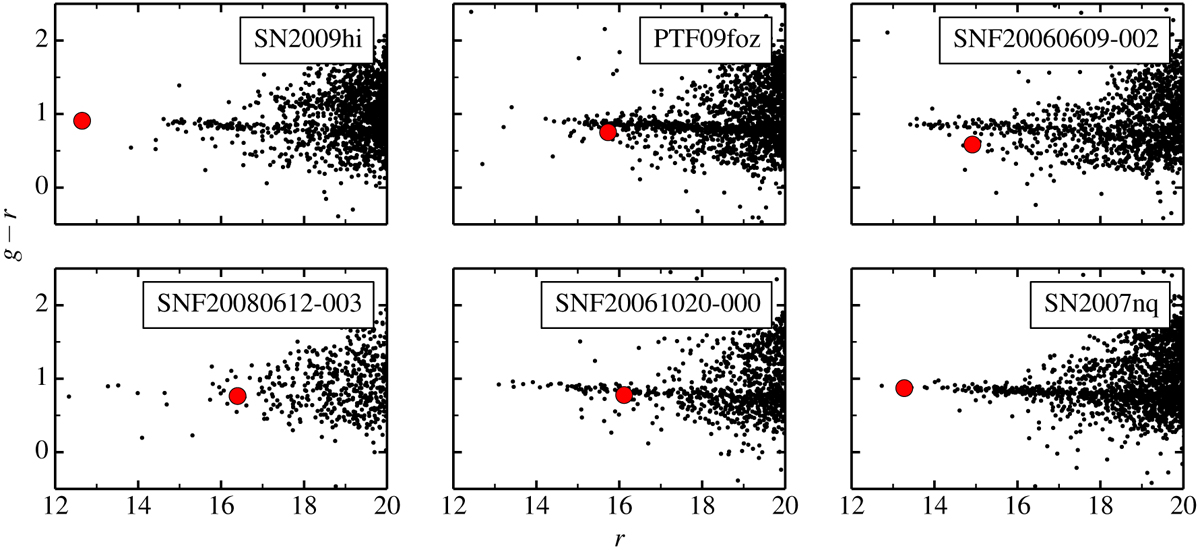
Color-magnitude diagram (g − r vs. r) plotted for the clusters from Table 1 for the six clusters for which SDSS galaxy redshifts and colors are available (Eisenstein et al. 2011; Dawson et al. 2013; Smee et al. 2013; SDSS Collaboration 2017). Red points show the positions of supernova hosts, most of which are located near the red sequence.
Current usage metrics show cumulative count of Article Views (full-text article views including HTML views, PDF and ePub downloads, according to the available data) and Abstracts Views on Vision4Press platform.
Data correspond to usage on the plateform after 2015. The current usage metrics is available 48-96 hours after online publication and is updated daily on week days.
Initial download of the metrics may take a while.