Open Access
Fig. 1
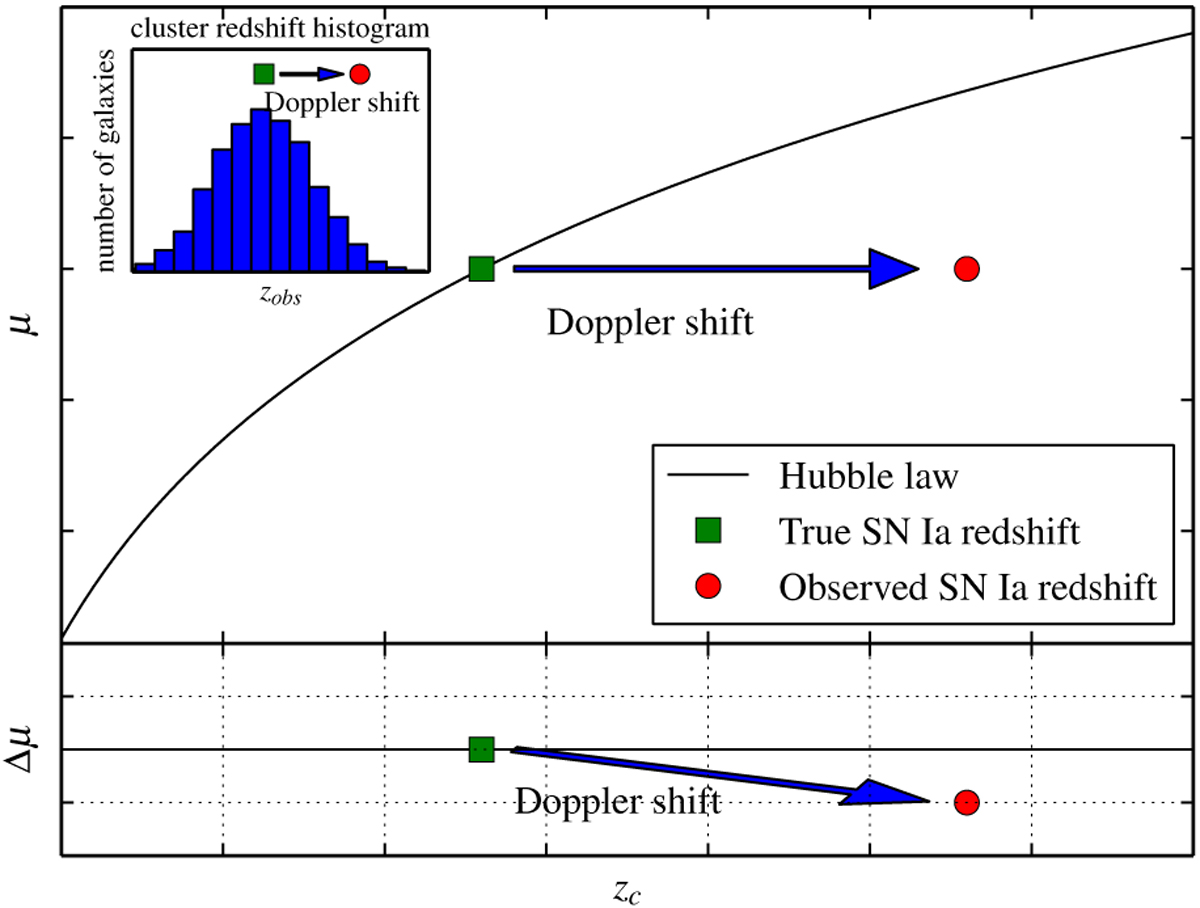
Hubble diagram demonstrating how large peculiar velocity can affect the measurements of the expansion history of the Universe. The inset plot is a typical velocity distribution of galaxies inside a cluster.
Current usage metrics show cumulative count of Article Views (full-text article views including HTML views, PDF and ePub downloads, according to the available data) and Abstracts Views on Vision4Press platform.
Data correspond to usage on the plateform after 2015. The current usage metrics is available 48-96 hours after online publication and is updated daily on week days.
Initial download of the metrics may take a while.