Fig. 9
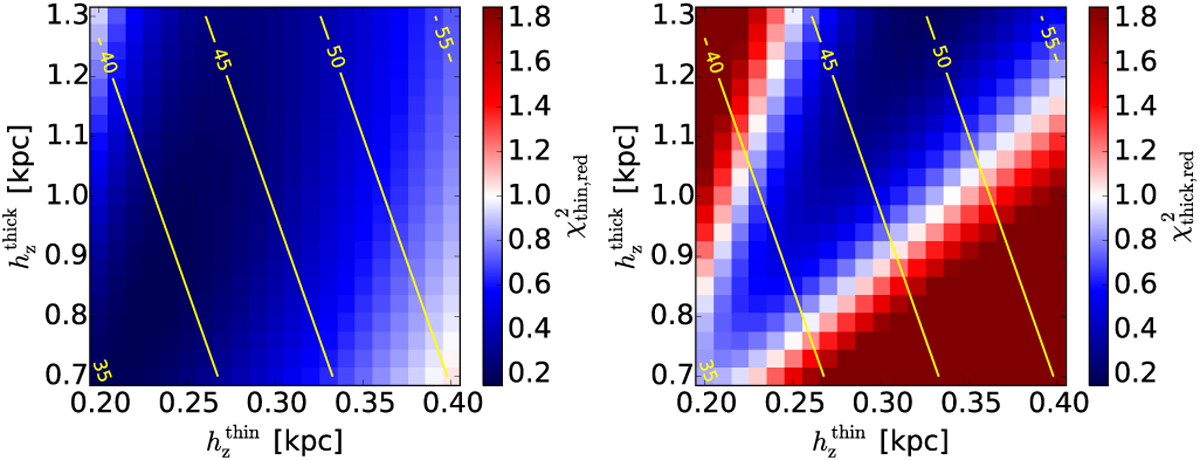
Maps of the reduced χ2 values computed for the thin (left) and thick (right) disk samples separately. The thin disk sample is generally fitted well with the minimization of the joint χ2, and this is because it contributes with a larger number of data points with smaller error bars. This is not the case for the thick disk, where for certain combinations of the scale heights the fit is poor for this sample (![]() ).
).
Current usage metrics show cumulative count of Article Views (full-text article views including HTML views, PDF and ePub downloads, according to the available data) and Abstracts Views on Vision4Press platform.
Data correspond to usage on the plateform after 2015. The current usage metrics is available 48-96 hours after online publication and is updated daily on week days.
Initial download of the metrics may take a while.