Fig. 8
Left: χ2 values as functions of the local dark matter density for various combinations of the scale heights of the thin and thick disks. The (light to dark) blue curves have![]() kpc and
kpc and ![]() kpc, while those from orange to dark red have
kpc, while those from orange to dark red have ![]() kpc and
kpc and ![]() kpc. The thick black curve corresponds to the global minimum of the χ2 landscape, which is found for the model with
kpc. The thick black curve corresponds to the global minimum of the χ2 landscape, which is found for the model with ![]() kpc and
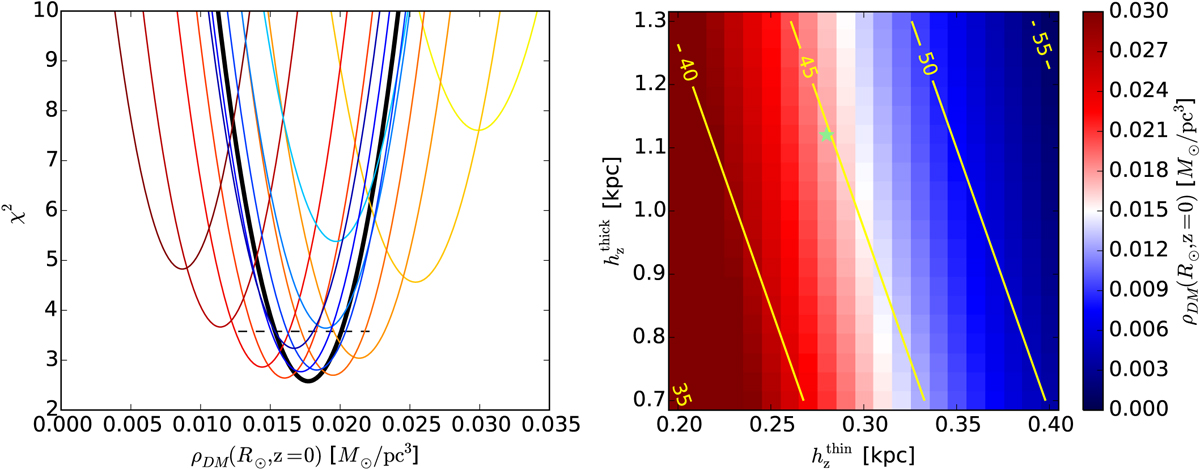
kpc and ![]() kpc. The horizontal dashed line indicates a Δχ2 = 1 with respect to this minimum χ2-value. Right: map showing the dependence of the best-fit values of the local dark matter density on the adopted scale height for the thin (x-axis) and thick (y-axis) disk. The total χ2 is minimum at the position of the star symbol. The yellow lines indicate where the total baryonic surface mass density in the models equals 35, 40, 45, 50, and 55 M⊙ pc−2.
kpc. The horizontal dashed line indicates a Δχ2 = 1 with respect to this minimum χ2-value. Right: map showing the dependence of the best-fit values of the local dark matter density on the adopted scale height for the thin (x-axis) and thick (y-axis) disk. The total χ2 is minimum at the position of the star symbol. The yellow lines indicate where the total baryonic surface mass density in the models equals 35, 40, 45, 50, and 55 M⊙ pc−2.
Current usage metrics show cumulative count of Article Views (full-text article views including HTML views, PDF and ePub downloads, according to the available data) and Abstracts Views on Vision4Press platform.
Data correspond to usage on the plateform after 2015. The current usage metrics is available 48-96 hours after online publication and is updated daily on week days.
Initial download of the metrics may take a while.