Fig. 7
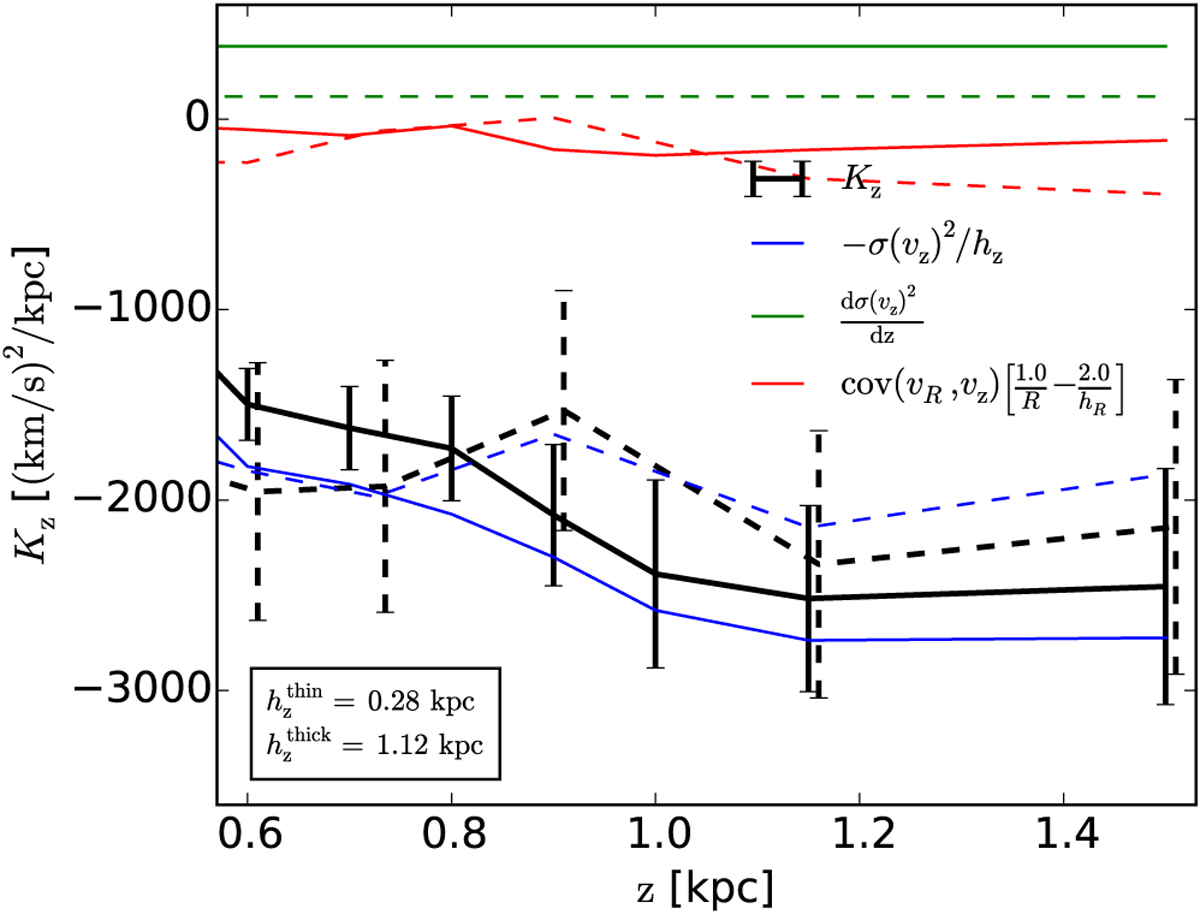
Derived vertical force Kz (black lines) for the thin (solid lines) and the thick disk samples (dashed lines). The coloured lines show the decomposition of Kz into the terms concerning the vertical velocity dispersion (blue), the slope of the vertical variance as function of z (green), and the mixed velocity moment (red). The curves shown were computed for the combination![]() kpc an
kpc an![]() kpc.
kpc.
Current usage metrics show cumulative count of Article Views (full-text article views including HTML views, PDF and ePub downloads, according to the available data) and Abstracts Views on Vision4Press platform.
Data correspond to usage on the plateform after 2015. The current usage metrics is available 48-96 hours after online publication and is updated daily on week days.
Initial download of the metrics may take a while.