Fig. 4
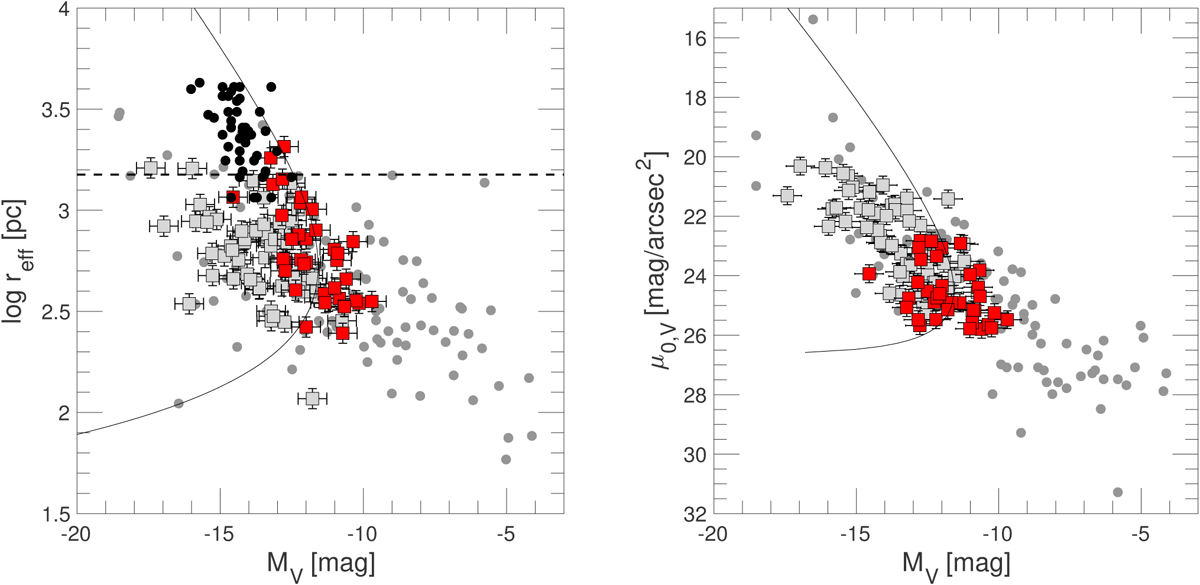
Scaling relations (reff – M) and (μ0 – M) for the newly discovered dwarf candidates (red squares), previously discovered dwarf members (gray squares), and the Local Group dwarf galaxy population (gray dots). The estimated conservative completeness limit, as derived in Müller et al. (2017b), is indicated with the line. The UDG candidates discovered in Coma (van Dokkum et al. 2015) are overlaid as black dots in the (reff – M) diagram; also overlaid is the size cut (dashed line) of 1.5 kpc for UDGs.
Current usage metrics show cumulative count of Article Views (full-text article views including HTML views, PDF and ePub downloads, according to the available data) and Abstracts Views on Vision4Press platform.
Data correspond to usage on the plateform after 2015. The current usage metrics is available 48-96 hours after online publication and is updated daily on week days.
Initial download of the metrics may take a while.