Fig. 2.
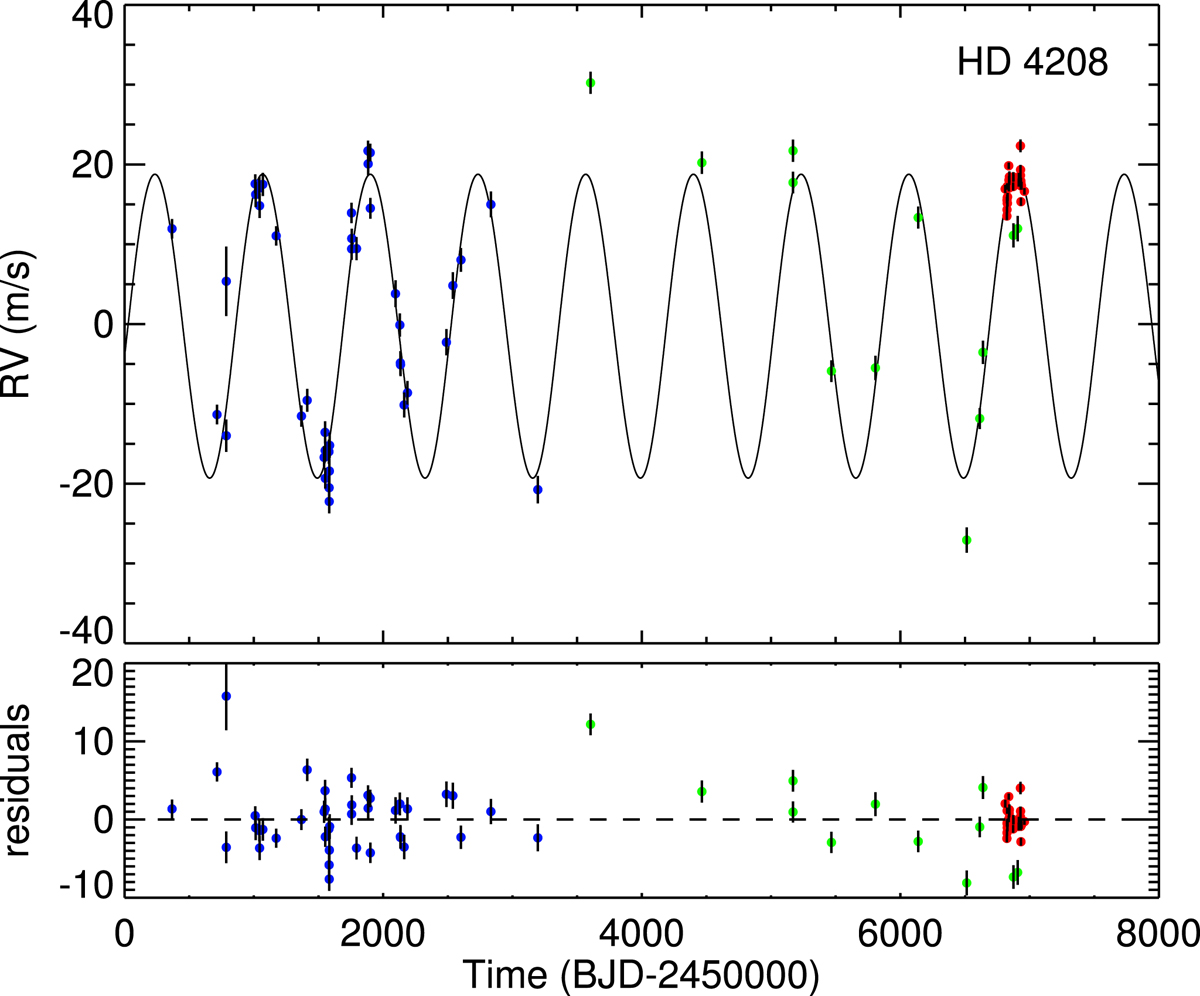
Analysis results for system HD 4208. In the top panel, our bestfit solution is superimposed as a black curve on the literature datapoints from two Keck surveys (shown in blue and green) and from our HARPS observations (shown in red). Bottom panel: residual radial velocities obtained after subtracting our best-fit solution for HD 4208 b from the original datapoints.
Current usage metrics show cumulative count of Article Views (full-text article views including HTML views, PDF and ePub downloads, according to the available data) and Abstracts Views on Vision4Press platform.
Data correspond to usage on the plateform after 2015. The current usage metrics is available 48-96 hours after online publication and is updated daily on week days.
Initial download of the metrics may take a while.