Fig. 1.
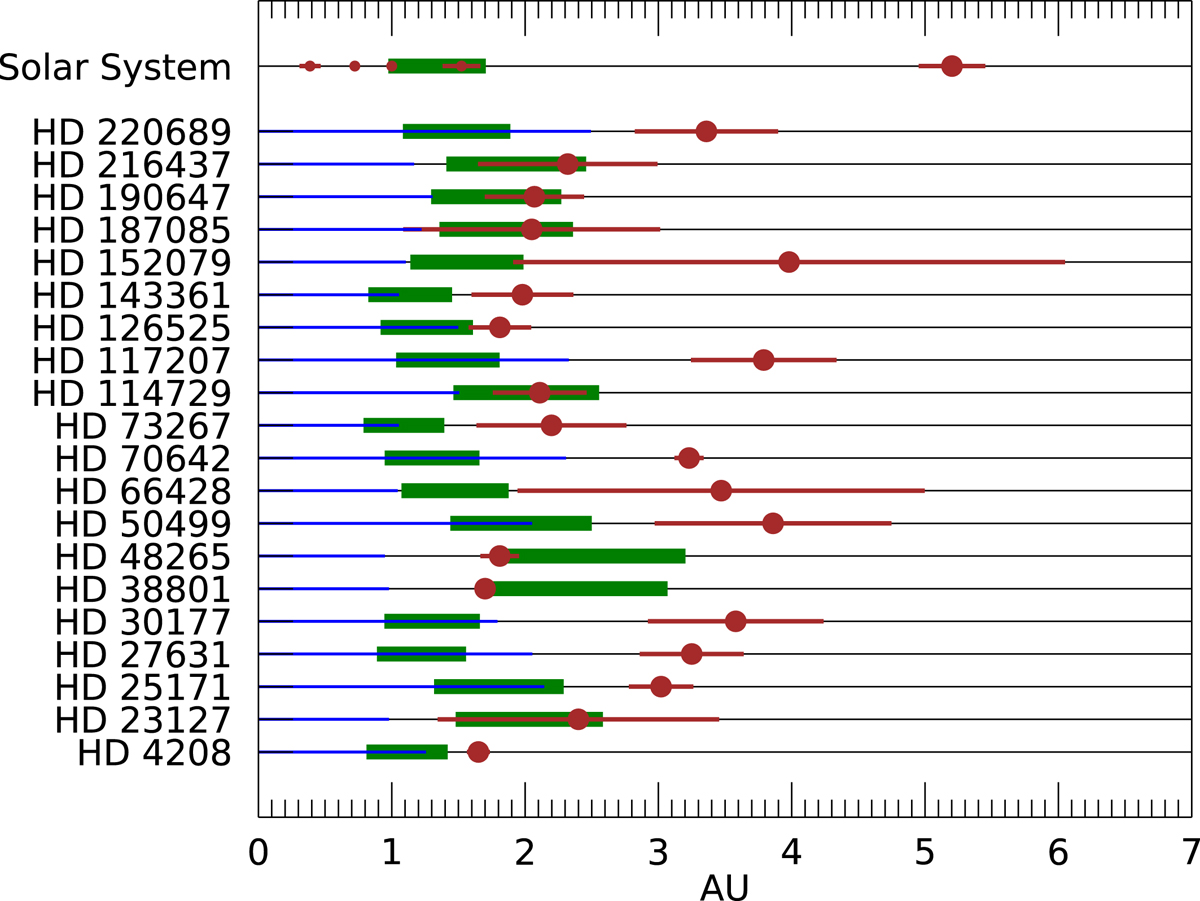
Overview of the sample systems and a comparison with the inner solar system architecture. Known giant planets of the sample are shown as brown circles, a thin brown line from periastron to apoastron showing their orbit’s span. Each system’s habitable zone, computed using the model detailed in Kopparapu et al. (2013), is shown as a thick green band, while the thin blue line indicates each system’s region of dynamical stability for additional inner planets as computed through Hill’s criterion detailed in Sect. 4.
Current usage metrics show cumulative count of Article Views (full-text article views including HTML views, PDF and ePub downloads, according to the available data) and Abstracts Views on Vision4Press platform.
Data correspond to usage on the plateform after 2015. The current usage metrics is available 48-96 hours after online publication and is updated daily on week days.
Initial download of the metrics may take a while.