Fig. 2.
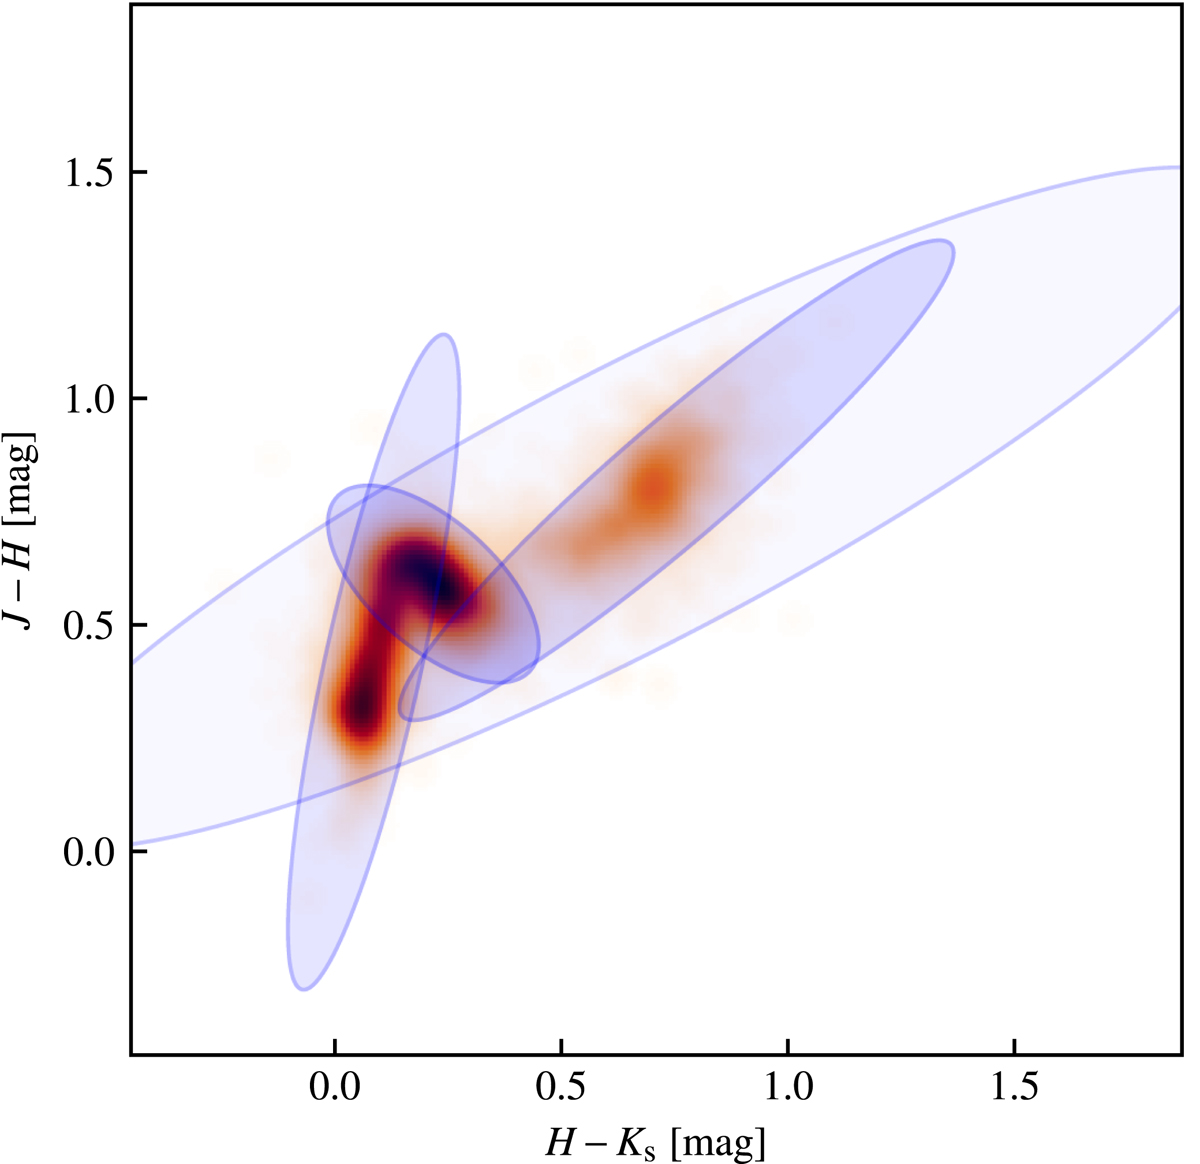
Extreme deconvolution of the control field colors. Overimposed on the same density plot as in Fig. 1, we show ellipses corresponding to the various Gaussian distributions used in the mixture that describes this intrinsic color probability distribution. For clarity, the ellipses are 50% larger than the covariance matrices of the corresponding components. The ellipse fill color is proportional to the weight of each component. Although the model used here has five components, only four are evident: the fifth is a large ellipse that encompasses the entire figure, with a very small weight.
Current usage metrics show cumulative count of Article Views (full-text article views including HTML views, PDF and ePub downloads, according to the available data) and Abstracts Views on Vision4Press platform.
Data correspond to usage on the plateform after 2015. The current usage metrics is available 48-96 hours after online publication and is updated daily on week days.
Initial download of the metrics may take a while.