Fig. 8.
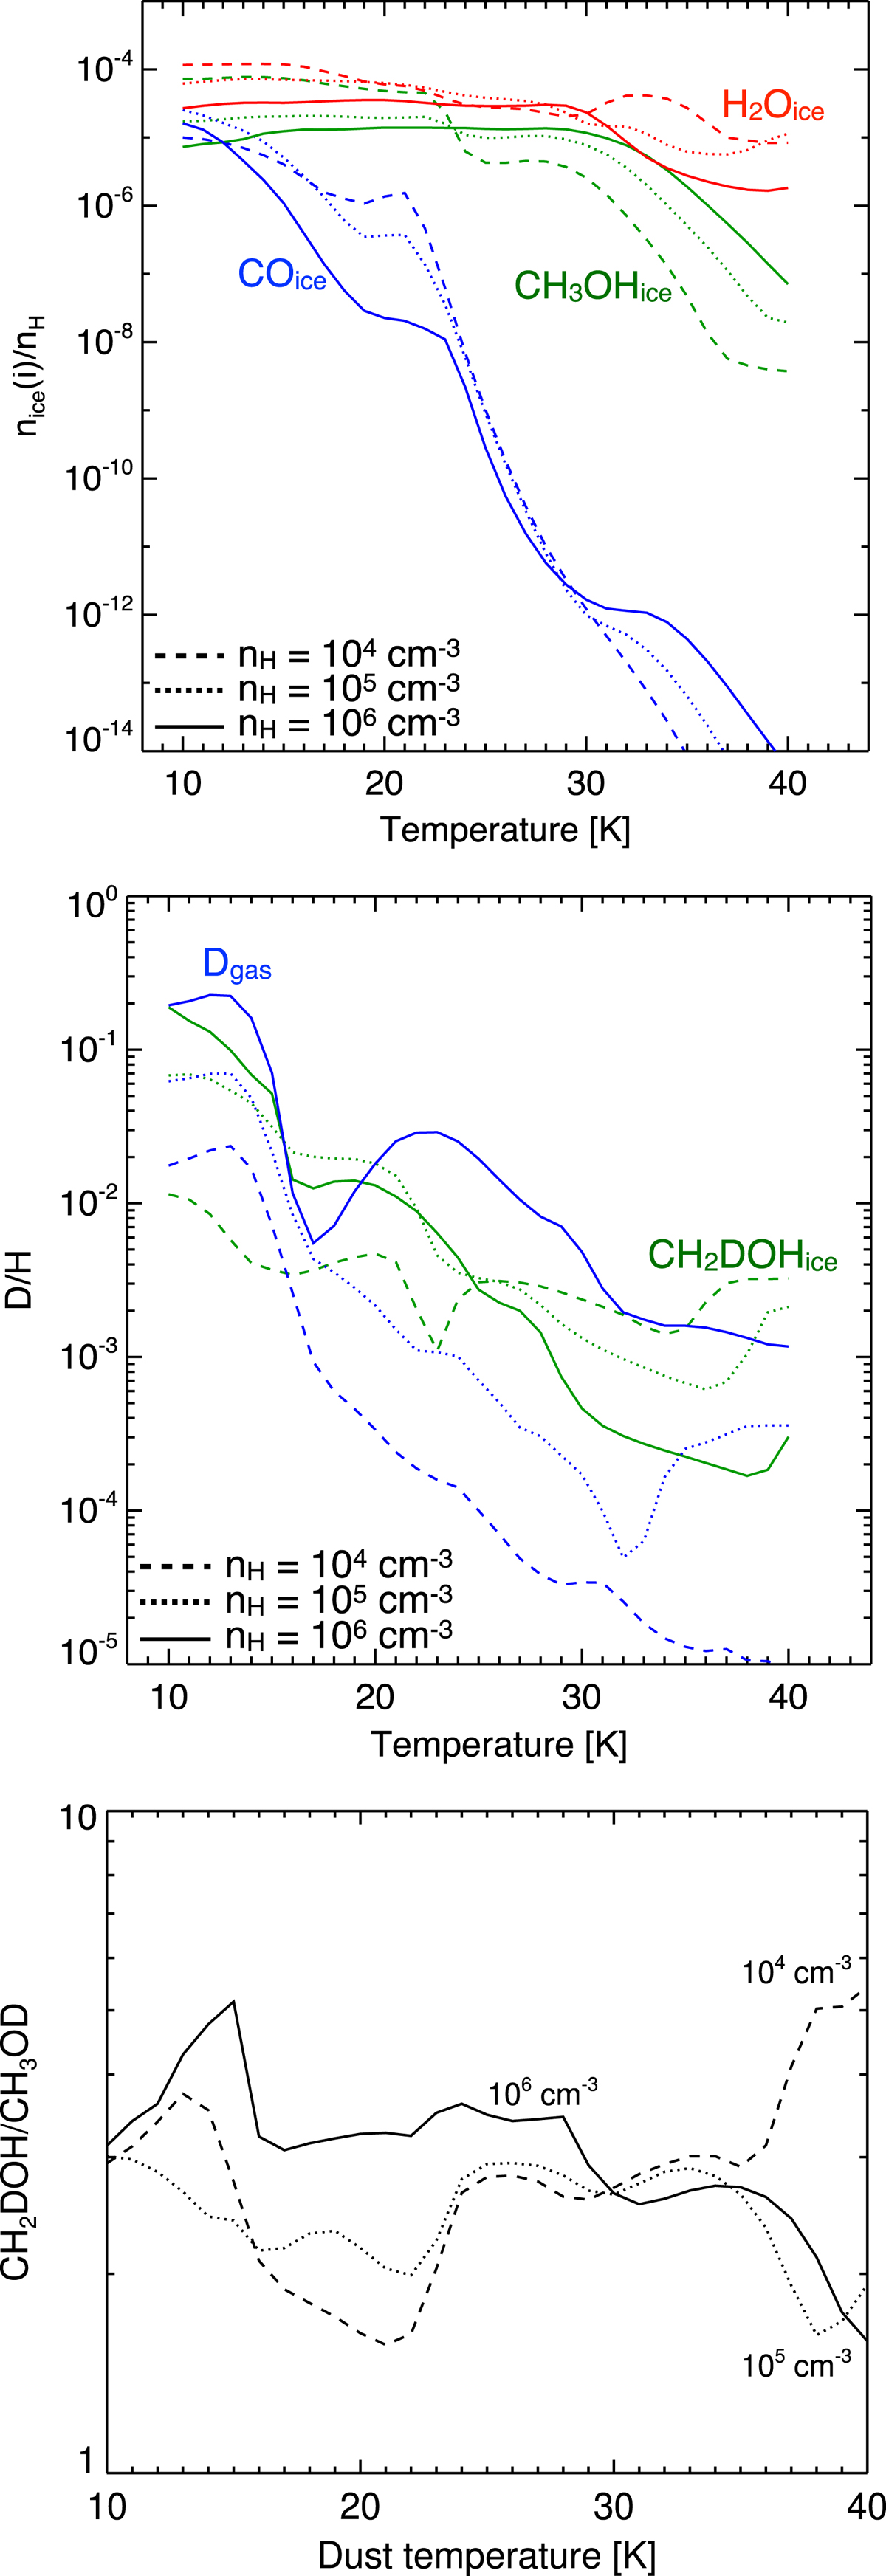
Top panel: final abundances of H2O (red lines), CO (blue lines), and CH3OH (green lines) in ices as a function of temperature. Middle panel: final CH2DOH to CH3OH abundance ratio in ices (green lines) and final atomic D/H in the gas phase (blue lines) as a function of temperature. Bottom panel: final CH2DOH to CH3OD abundance ratio as function of temperature. In all panels three densities are considered: nH = 104 (dashed), 105 (dotted), and 106 (solid) cm−3.
Current usage metrics show cumulative count of Article Views (full-text article views including HTML views, PDF and ePub downloads, according to the available data) and Abstracts Views on Vision4Press platform.
Data correspond to usage on the plateform after 2015. The current usage metrics is available 48-96 hours after online publication and is updated daily on week days.
Initial download of the metrics may take a while.