Fig. 4.
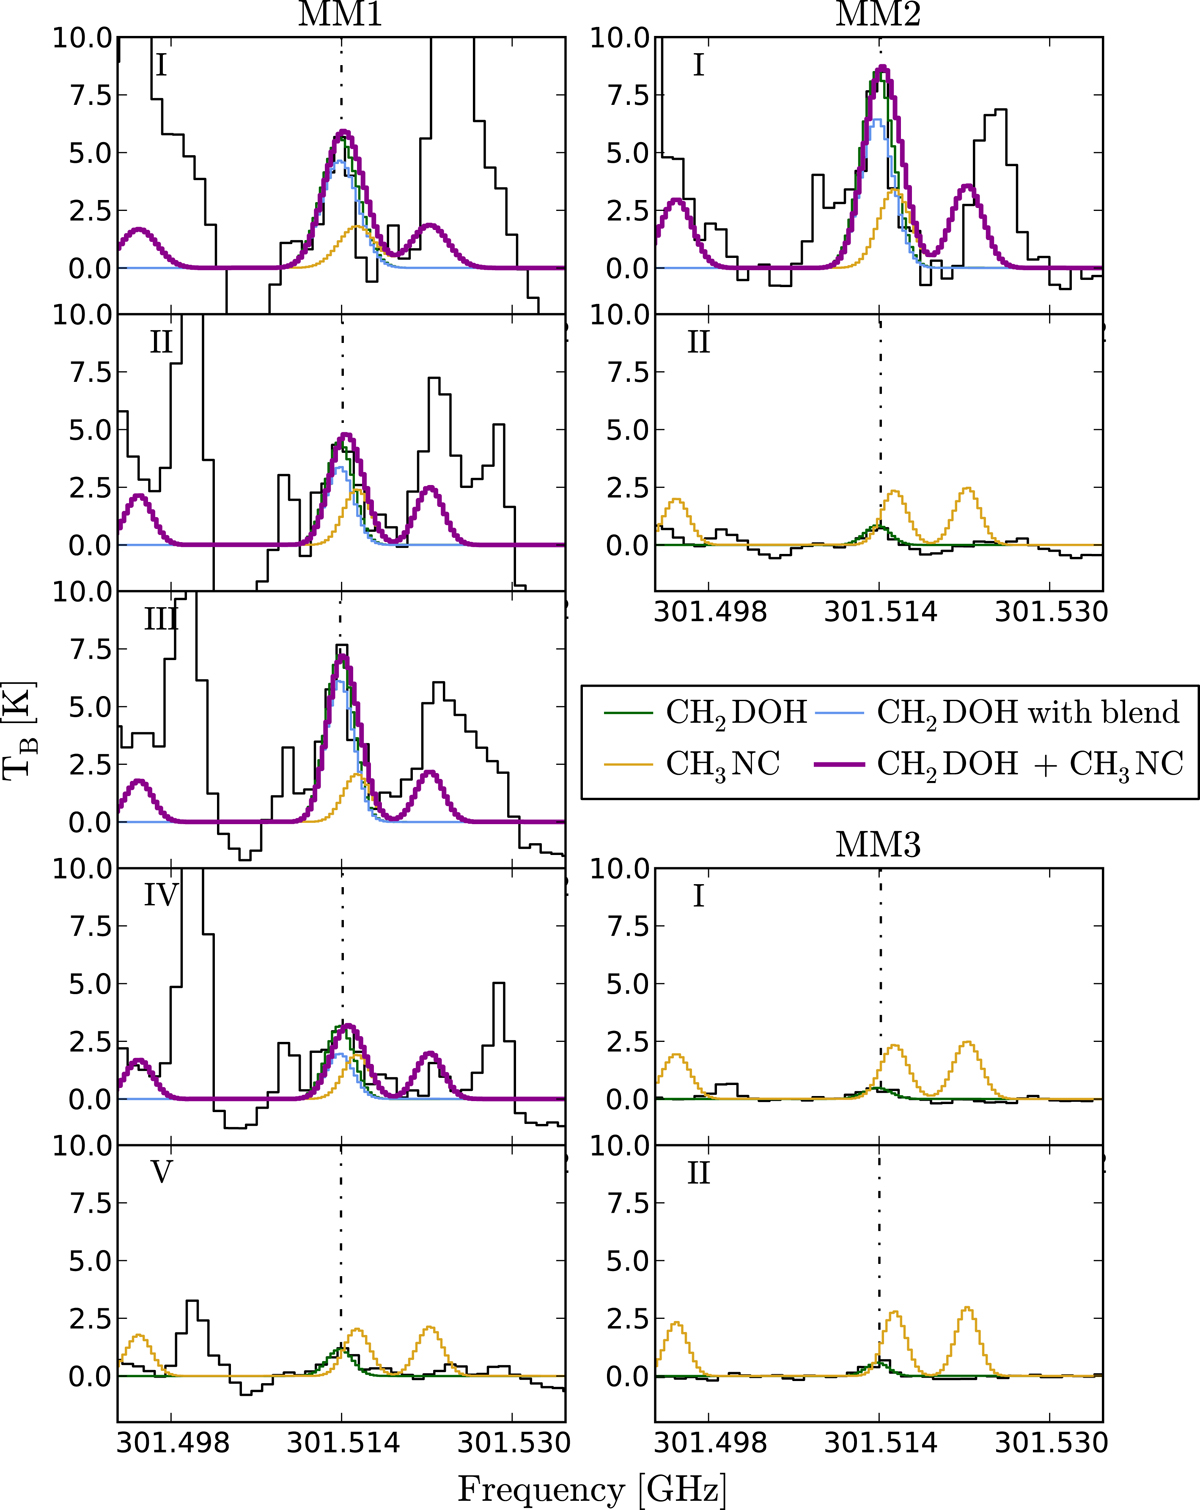
CH2DOH 12(2,11)→12(1,12) transition at 301.514 GHz (indicated by dash-dotted lines) detected towards each region. Frequencies are shifted to the rest frame of the individual regions. Blue and green lines represent the modelled spectra of CH2DOH with and without blending, i.e., including and excluding the contribution from CH3NC, respectively. Yellow lines represent the modelled spectra of CH3NC and magenta lines represent the sum of the spectra of CH2DOH with blending and CH3NC.
Current usage metrics show cumulative count of Article Views (full-text article views including HTML views, PDF and ePub downloads, according to the available data) and Abstracts Views on Vision4Press platform.
Data correspond to usage on the plateform after 2015. The current usage metrics is available 48-96 hours after online publication and is updated daily on week days.
Initial download of the metrics may take a while.