Fig. C.2.
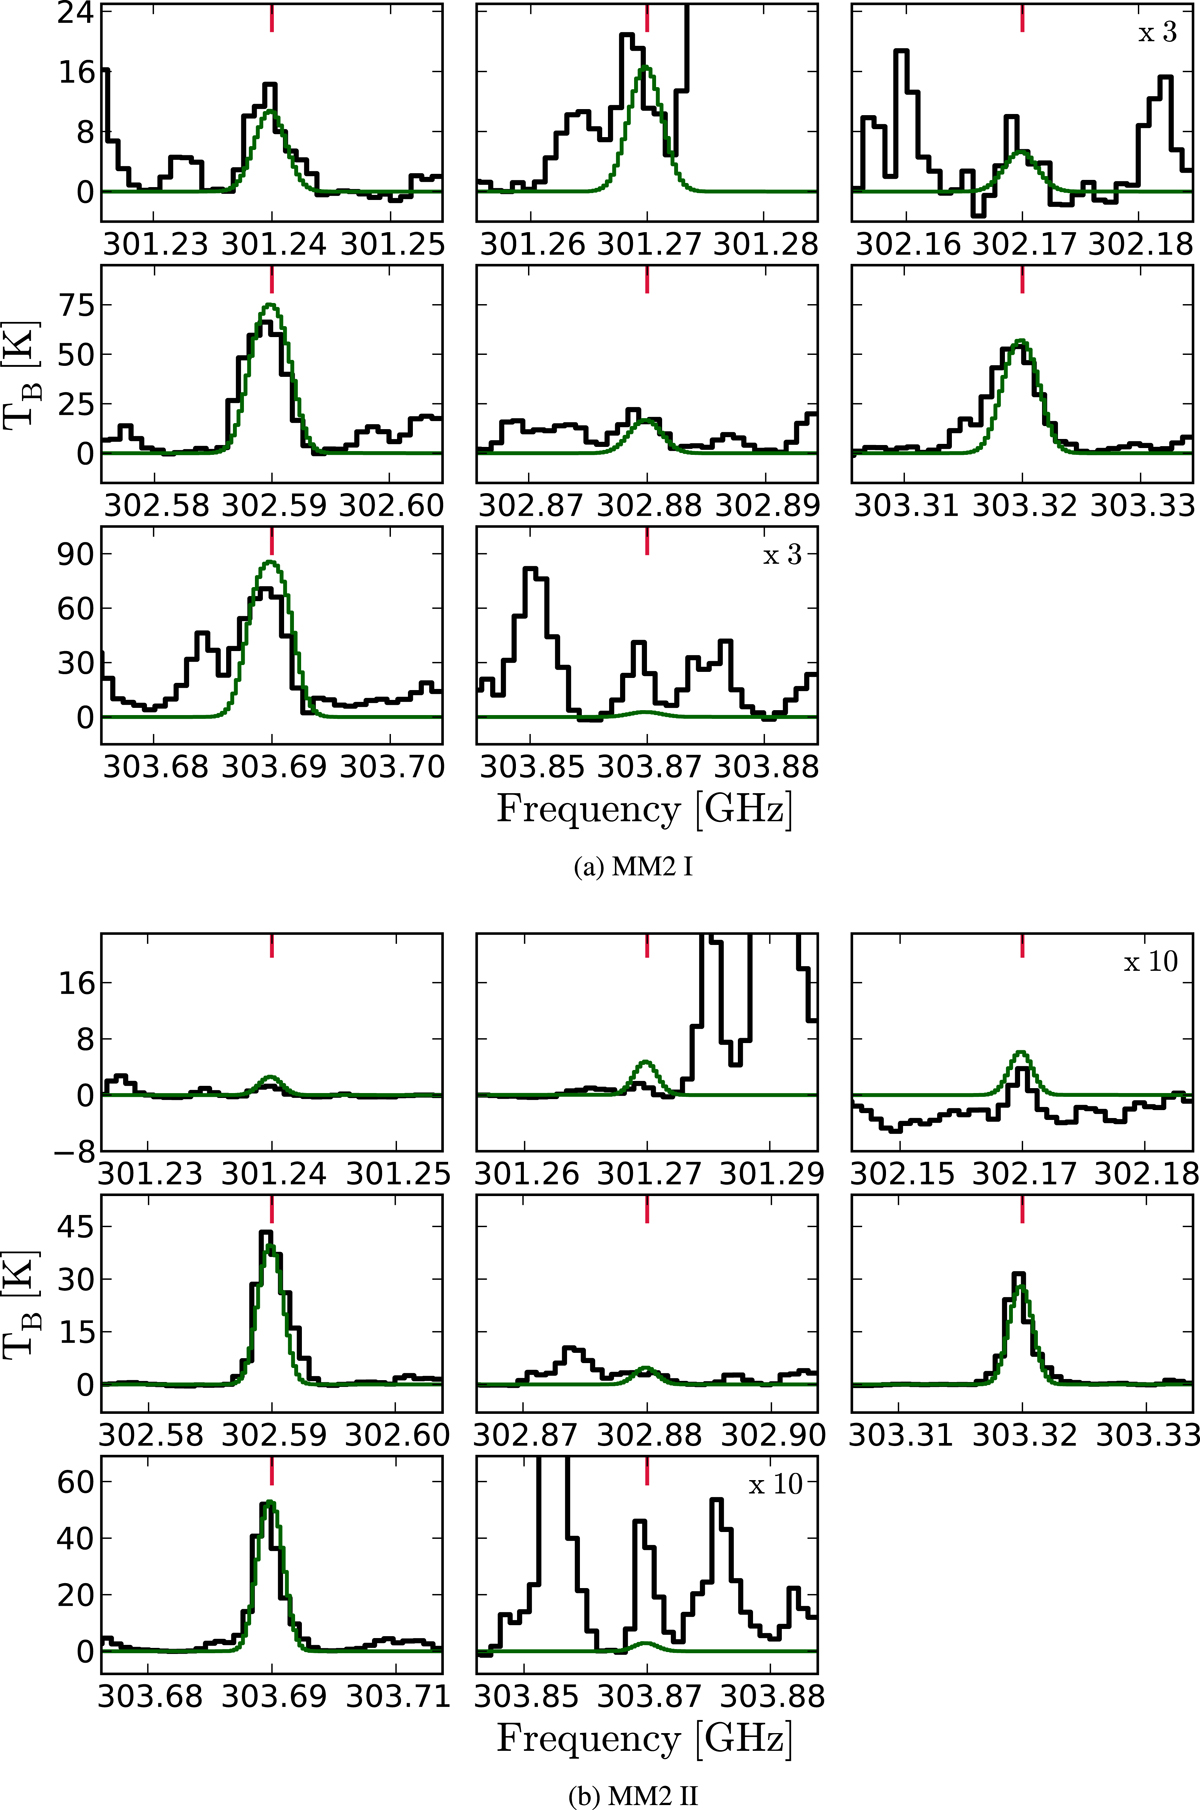
All 13CH3OH lines detected towards NGC 6334I MM2 I–II. Frequencies are shifted to the rest frame of the individual regions. Green lines represent the modelled spectra of 13CH3OH without blending, i.e., excluding the contribution from CH3OCHO (including the contribution from CH3OCHO does not change the 13CH3OH column density of the best-fit model). To enhance the readability of some panels, both data and model have been scaled up by the factor in the top right corner of the respective panel.
Current usage metrics show cumulative count of Article Views (full-text article views including HTML views, PDF and ePub downloads, according to the available data) and Abstracts Views on Vision4Press platform.
Data correspond to usage on the plateform after 2015. The current usage metrics is available 48-96 hours after online publication and is updated daily on week days.
Initial download of the metrics may take a while.