Fig. 1.
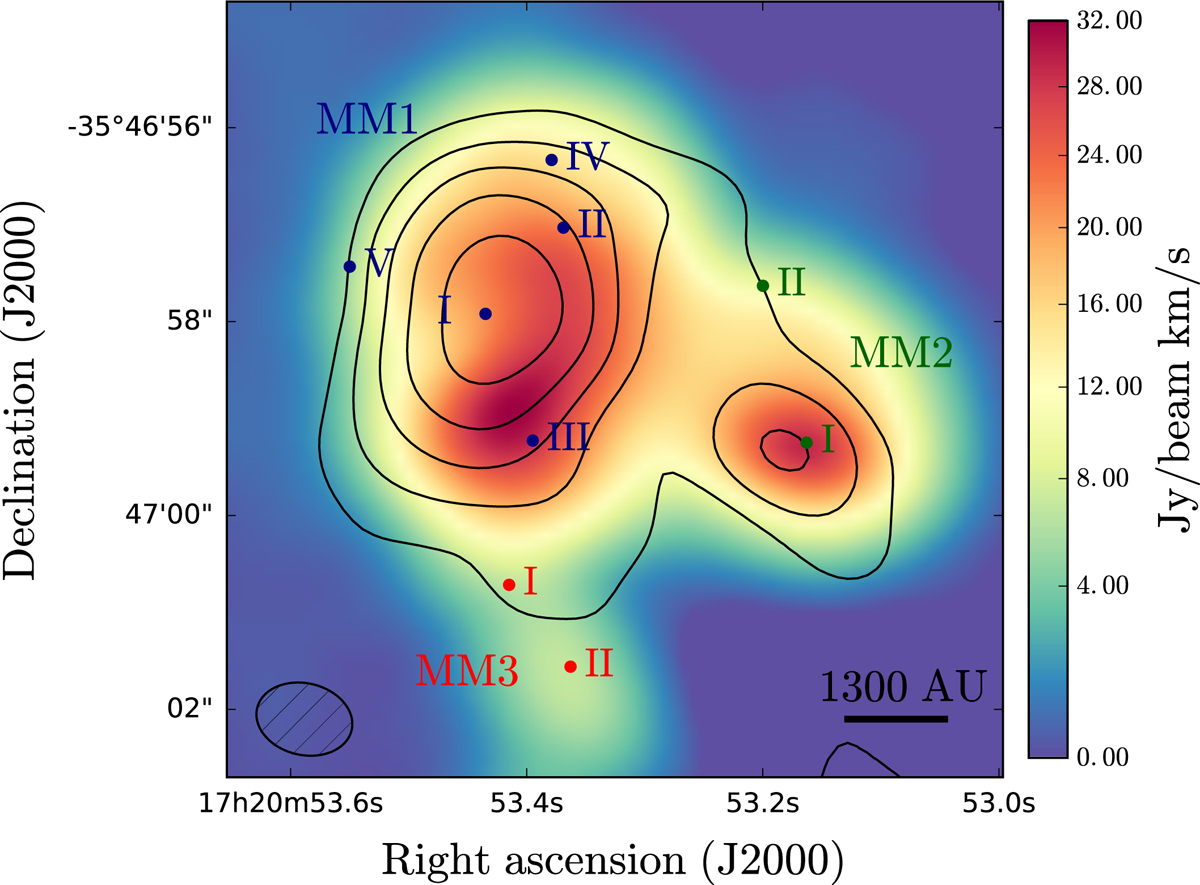
Velocity integrated intensity map of the 13CH3OH transition at 303.692 GHz with the 1 mm continuum image overlaid in black contours (levels are [10, 20, 40, 80, 160]σ with σ = 0.02 Jy beam−1). The locations at which spectra have been extracted are marked in blue for MM1, green for MM2 and red for MM3. The synthesised beam (~1300 × 962 AU) is shown in the bottom left corner.
Current usage metrics show cumulative count of Article Views (full-text article views including HTML views, PDF and ePub downloads, according to the available data) and Abstracts Views on Vision4Press platform.
Data correspond to usage on the plateform after 2015. The current usage metrics is available 48-96 hours after online publication and is updated daily on week days.
Initial download of the metrics may take a while.