| Issue |
A&A
Volume 615, July 2018
|
|
|---|---|---|
| Article Number | A157 | |
| Number of page(s) | 7 | |
| Section | Stellar structure and evolution | |
| DOI | https://doi.org/10.1051/0004-6361/201832733 | |
| Published online | 31 July 2018 | |
Discovery of a jet-like structure with overionized plasma in the SNR IC 443
1
Dipartimento di Fisica & Chimica, Università di Palermo, Piazza del Parlamento 1, 90134 Palermo, Italy
e-mail: This email address is being protected from spambots. You need JavaScript enabled to view it.
2
INAF-Osservatorio Astronomico di Palermo, Piazza del Parlamento 1, 90134 Palermo, Italy
3
NASA Goddard Space Flight Center, 8800 Greenbelt RD, Greenbelt, MD 20771, USA
4
Department of Astronomy, University of Maryland, College Park, MD 20742-4111, USA
Received:
30
January
2018
Accepted:
12
April
2018
Abstract
Context. IC 443 is a supernova remnant (SNR) located in a quite complex environment since it interacts with nearby clouds. Indications for the presence of overionized plasma have been found though the possible physical causes of overionization are still debated. Moreover, because of its peculiar position and proper motion, it is not clear if the pulsar wind nebula (PWN) within the remnant is the relic of the IC 443 progenitor star or just a rambling one seen in projection on the remnant.
Aims. Here we address the study of IC 443 plasma in order to clarify the relationship PWN-remnant, the presence of overionization and the origin of the latter.
Methods. We analyzed two XMM-Newton observations producing background-subtracted, vignetting-corrected and mosaicked images in two different energy bands and we performed a spatially resolved spectral analysis of the X-ray emission.
Results. We identified an elongated (jet-like) structure with Mg-rich plasma in overionization. The head of the jet is interacting with a molecular cloud and the jet is aligned with the position of the PWN at the instant of the supernova explosion. Interestingly, the direction of the jet of ejecta is somehow consistent with the direction of the PWN jet.
Conclusions. Our discovery of a jet of ejecta in IC 443 enlarge the sample of core-collapse SNRs with collimated ejecta structures. IC 443’s jet is the first one which shows overionized plasma, possibly associated with the adiabatic expansion of ejecta. The match between the jet’s direction and the original position of the PWN strongly supports the association between the neutron star and IC 443.
Key words: ISM: supernova remnants / ISM: individual objects: IC443 / pulsars: individual: CXOU J061705.3+222127
© ESO 2018
1. Introduction
Supernova remnants (SNRs) are divided into different categories according to different morphological features. One of the most interesting and less understood is the mixed morphology (MM) class which shows thermal peaked X-ray emission in the inner shells and peaked radio emission in the remnant outline. In recent years, several works have found signatures of overionized plasma in this class of SNRs (e.g., Ozawa et al. 2009; Miceli et al. 2010; Zhou et al. 2011 for W49b; Uchida et al. 2012 for W44; Sawada & Koyama 2012 for W28). For IC 443, marginal evidence of overionized plasma was detected in the inner region characterized by bright X-ray emission (Kawasaki et al. 2002; Troja et al. 2008), and later confirmed by Suzaku observations (Yamaguchi et al. 2009; Ohnishi et al. 2014; Matsumura et al. 2017, hereafter M17).
The source IC 443 (also called G189.1+3.0) belongs to the GEM OB1 association at a distance of 1.5 kpc (Welsh & Sallmen 2003). Its radius is ≈20′, its age is ≈4000 yr (Troja et al. 2008) and it is an MM SNR (Rho & Petre 1998). It is located in a very complex environment since it interacts with a molecular cloud in the northwestern (NW) and southeastern (SE) areas and with an atomic cloud in the northeast (NE). The molecular cloud lies on the foreground of IC 443 forming a semi-toroidal structure (Burton et al. 1988; Troja et al. 2006; Su et al. 2014).
The PWN CXOU J061705.3+222127 is observed within the remnant shell. However, since it is far away from the geometric center of the remnant (it is near the southern edge) and moves towards southwest (SW), it is not clear if the PWN belongs to IC 443 (Gaensler et al. 2006, Swartz et al. 2015) or is a rambling neutron star (NS) seen in projection on the remnant.
In this paper we present our analysis of deep XMM-Newton observations of IC 443. This analysis has revealed for the first time a jet-like structure of overionized plasma in the NW part of the remnant. The identification of this structure is interesting because X-ray emitting jets of ejecta have been discovered and analyzed only in other two core-collapse SNRs, namely Cas A (Hwang et al. 2004; Fesen et al. 2006) and, recently, Vela SNR (García et al. 2017). Structures of this kind are not well understood and some authors have suggested that they may be deeply related to the physical mechanism of the SN explosion (Wilson 1985; Janka et al. 2016; Grichener & Soker 2017).
The paper is organized as follows: observations and data reduction are described in Sect. 2; image and spectral analysis are illustrated in Sect. 3; discussion about results can be found in Sect. 4.
2. Observations and data analysis
The source IC 443 has been observed several times with the European Photon Imaging Camera (EPIC) on board of XMM-Newton. We analyzed nine observations in order to build complete images of IC 443 but only two of them (ID 0114100201 and 0114100501, PI Fred Jansen) were used for the spectral analysis since they are the only ones which have the jet within the field of view (FOV; Table 1).
We used the Science Analysis System (SAS), version 16.1.0, to perform the whole data analysis. We used the task ESPFILT to eliminate contamination due to soft protons, reducing the effective exposure time (third column of Table 1). The task ESPFILT extracts two lightcurves for the events detected inside and outside of the FOV and creates a high energy count rate histogram from the field-of-view data. The histogram has a Gaussian peak at the nominal count rate (i.e. the count rate measured during time intervals not contaminated by protonic flares) with a high count rate tail. The shape of this Gaussian peak significantly depends on the data contamination. If the peak is narrow, ESPFILT is not able to properly filter events. However, in our case, the peak has a bump-like shape and ESPFILT can fit a Gaussian to the peak and determine thresholds that we set at 1.5˙. Time intervals corresponding to the points within this threshold are labeled as “good time intervals”, while those above it are removed from the event list. For the whole analysis we considered only data with FLAG = 0 and PATTERN <13, <5 for MOS, PN cameras respectively, as the XMM-Newton handbook suggests1.
We built background-subtracted images of IC 443 in two different bands: Soft (0.5–1.4 keV) and Hard (1.4–5.0 keV), same as in Troja et al. (2008). We used a double subtraction procedure in order to subtract background contribution and correct for the vignetting, similar to Miceli et al. (2017). We subtracted the non-photonic background in our data and in the EPIC high signal-to-noise background event files2 by scaling the EPIC Filter Wheel Closed files3 data. Before subtraction, we used the ratio of count-rates in the corners of the charge-coupled devices (CCDs), namely the part of the cameras outside of FOV, as a scaling factor. We then subtracted the photonic background from our pure photonic data. Moreover, we combined the observations using the task emosaic. Finally, we adaptively smoothed the mosaicked image with the task asmooth to a signal to noise ratio of 25. In all images, north is up and east is to the left.
We used the SAS tool evigweight to correct vignetting effect in the spectra. We applied tasks rmfgen and arfgen obtaining response and ancillary matrices and we binned spectra to obtain at least 25 counts per bin. The spectral analysis has been performed with XSPEC (version 12.9, Arnaud 1996) in the energy range 0.6–5 keV for all cameras. PN and MOS1,2 spectra of the two observations were fitted simultaneously. We selected two different regions outside the shell to extract background spectra and we verified that the best fit results do not depend on the choice of the background. Errors are at 2σ confidence levels and χ2 statistics are used.
We also built a Chandra image of the PWN CXOU J061705.3+222127 located near the southern rim of the remnant in the 0.5–7 keV energy band. We analyzed observations 13 736 and 14 385 (PI Weisskopf), for a total exposure time of 152 ks, through the software CIAO version 4.7. We used the CIAO task fluximage which created exposure-corrected images for the observations (merged with the task merge_obs). Scales in pc shown in the images are calculated assuming a distance of 1.5 kpc, according to Welsh & Sallmen (2003).
Main information about all observations.
3. Results
3.1. Image analysis
In Fig. 1 we display the count-rate image of IC 443 in the Hard energy band (1.4–5 keV). The white contour in the upper panel traces the semi-toroidal molecular cloud mentioned above (Burton et al. 1988). Until now, only the internal area of IC 443 has been studied in detail with XMM-Newton (Troja et al. 2006), while the elongated jet-like structure clearly evident within the cyan box (lower panel) in the NW has not been investigated yet. If we take a closer look at this area (Fig. 2), we can see that the jet, ≈3 pc long and indicated by the central black region, is the brightest area in the Hard energy band. The jet is characterized by a relatively narrow, well-collimated morphology which is also visible in the Soft band, though with a lower contrast. If we take into account the NS proper motion (≈130 km s−1 towards SW, Gaensler et al. 2006) and multiply it by the age of remnant (≈4000 yr, Troja et al. 2008), we can derive the position of the neutron star immediately after the explosion, as shown with the black cross in the lower panel of Fig. 1. We can see that the projection of the jet towards the PWN crosses the position which had the NS at the time of the explosion. This result is a clear indication of the link between the PWN and IC 443, given that the jet is made of ejecta expelled by the IC 443 progenitor, as we will show in Sect. 3.2. We also built an image of the area near the PWN using data from the Chandra telescope (Fig. 3). This image was produced by rebinning the events files to 0.246″, namely the half of the nominal pixel size (0.492″), as in Swartz et al. (2015).
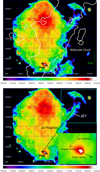 |
Fig. 1. Background-subtracted and vignetting-corrected count-rate images of IC 443 in the Hard band (1.4–5 keV) obtained by combining all the EPIC cameras. The image is adaptively smoothed to a signal-to-noise ratio of 25, the bin size is 6″ and the color scale is logarithmic. In the upper panel, the black box marks the PWN (and the field of view of Fig. 3), the black arrows marks the proper motion of the PWN, the black cross indicates the original position of the PWN (immediately after the explosion) and the white contours traces the molecular cloud as reported by Burton et al. (1988). In the lower panel, the cyan box marks the jet (and the field of view of Fig. 2), the dashed black line is the projection of the jet toward the PWN and the dashed red box is the FOV of the insert in the lower panel. This close-up view shows a detail of the PWN area with the original position and proper motion marked by the black cross and black arrow, respectively. |
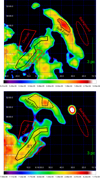 |
Fig. 2. Close-up view of the jet area marked by the cyan box in Fig. 1 in the Soft band (0.5–1.4 keV, top) and in the Hard band (1.4–5 keV, bottom). The image is adaptively smoothed to a signal-to-noise ratio 25, the bin size is 6″ and the color scale is logarithmic. Jet region is marked in black, Soft Front and Hard Front are marked in dashed black, background region in dashed red and OverJet and UnderJet regions in red. |
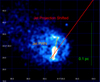 |
Fig. 3. Chandra image of the area near the PWN which provides a comparison between the SNR and the PWN jets in the 0.5–7 keV energy band. The image is smoothed with a Gaussian with σ = 2 pixel, the pixel size is 0.246″ and the color scale is linear. The projection of the jet has been shifted on the PWN in order to compare the two jets’ direction. |
The projection of the jet is shifted on the PWN maintaining its direction in order to compare the jet’s direction with the direction of the PWN jet, detected by Swartz et al. (2015). The directions of the two jets are somehow consistent and this may be suggestive of some physical link between their origins. In Vela SNR, the jet-like structure detected by García et al. (2017) is not clear as in IC 443 but it is still possible to measure the angle between the PWN jet and the SNR jet. In that SNR the angle is of ≈90°, as can be derived by comparing the jet detected by García et al. (2017) with the PWN jet showed by Pavlov et al. (2003).
3.2. Spatially resolved spectral analysis
In Fig. 2 it is clear that the jet is much brighter than the adjacent regions, labeled OverJet and UnderJet (in red), particularly in the Hard band. We investigated the nature of the plasma through spectral fits and found that regions OverJet and UnderJet are both satisfyingly described by a model of plasma in collisional ionization equilibrium (VAPEC model, the spectrum relative to the OverJet region is shown in Fig. 4). The resulting best-fit parameters for the two regions are all consistent within two sigmas, except for nH, (namely the column density nH = ∫ ndl where n is the particle density and the integral is calculated along the line of sight). The latter result is not surprising since the molecular cloud (indicated by the white contours in Fig. 1) is on the foreground and the OverJet region is completely covered by the cloud whereas the UnderJet region is only partially covered by it and it is close to the cloud border in projection. Since both regions are well described with a VAPEC model, it is natural to affirm that X-ray emission is associated with shocked interstellar medium (ISM) in OverJet and UnderJet.
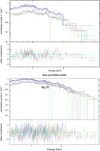 |
Fig. 4. Upper panel: EPIC spectra of the OverJet region obtained simultaneously fitting spectra from six cameras with a VAPEC model (best fit parameters can be found in Table 2). Lower panel: same as is the upper one but for the Jet region described with a VAPEC + VRNEI model (best fit parameters can be found in Table 3). |
However, when fitting the jet’s spectra, we needed to add a second thermal component to properly fit the spectra because a single VAPEC component gives a χ2 = 643.88 with 506 degrees of freedom (d.o.f.). The best fit parameters of the soft thermal component are consistent within 2σ with those of the UnderJet and OverJet regions. We then fixed the abundances of this soft component to those of the OverJet region and we forced the temperature of this component to vary in the range 0.38–0.44 keV, as in the OverJet region, letting only the emission measure free to vary. Thanks to the new component, the quality of the fit drastically improved (χ2 = 613.77 with 506 d.o.f.). Since this new component showed oversolar abundances (Table 3), we associate it with shocked ejecta while the quite homogeneous soft X-ray emission in all the three regions is due to shocked ISM.
It that emerged that it was impossible to estimate absolute abundances. Since spectra are dominated by line emission and the jet area is quite faint, it is impossible to estimate precisely the continuum and the intensity of each emission line: we can fit the data by enhancing all the abundances by the same factor f and reducing the emission measure by f without significant variation of χ2. In order to avoid partially this problem we considered relative abundances calculated with respect to Mg, the element which shows the most prominent line in the spectrum (see Fig. 4). With this approach, we constrained abundances satisfyingly (provided that Mg abundance is fixed during the error calculation). The error on Mg abundance is calculated fixing the Fe abundance.
Since previous works (Ohnishi et al. 2014; Yamaguchi et al. 2009 and M17) pointed out the presence of overionized plasma, we investigated whether the jet could show some indication of overionization. We substituted the hotter component of our twocomponents VAPEC model with a VRNEI model, which is used to describe plasma in recombination phase because of its rapid cooling. To this end, we assumed an initial temperature of 5 keV (in agreement with M17). The χ2 significantly decreased from 613.77 (506 d.o.f.) to 575.05 (506 d.o.f.). This result suggests that ejecta in the jet are overionized. In Table 3 we show the best fit results also for this VAPEC + VRNEI model for the jet. Figure 5 shows the PN-only spectrum extracted from observation 0114100501 with the contribution of the two spectral components. Below ≈ 1.4 keV, the ISM component is dominant while the VRNEI component becomes dominant at higher energies. In Fig. 4 spectra extracted from all cameras of both observations from regions OverJet and Jet are shown. It is clear that the spectrum of the region OverJet becomes significantly softer at higher energies than that of the jet region.
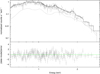 |
Fig. 5. EPIC PN spectrum of the jet extracted from observation 0114100501 showing two different components of the VAPEC + VRNEI model. In the lower panel residuals are displayed. |
As it appears from Fig. 2, the Front, namely the upper part of the jet, is different according to the energy band we are looking at, that is it is shifted to NE in the Hard band with respect to the Soft band. We analyzed spectra extracted from these regions finding that the Soft Front has chemical properties consistent within 2σ with those of the OverJet and UnderJet regions, being well described with a single VAPEC component with roughly solar abundances (Table 2). We interpret the enhanced brightness visible in Fig. 2 of this region as due to the interaction between the jet and the molecular cloud, as we will discuss in detail in Sect. 4. On the other hand, the Hard Front’s spectrum needs to be fitted with a two component VAPEC + VRNEI model providing a χ2 = 346.33 with 342 d.o.f. and showed abundances consistent with those of the jet within 2σ (Hard Front can also be described with a VAPEC + VAPEC model providing a χ2 = 342.57 with 342 d.o.f.). However, Hard Front plasma showed higher values of the ionization parameter (τ = 9 ± 1 × 10¹¹ against  found for the jet) and of the ratio Si/Mg ≈ 0.75, which is approximately ten times greater than in the jet (Si/Mg ≈ 0.08). This may be indicative of spatial inhomogeneities in physical and chemical properties of the jet. Nevertheless, the low surface brightness and poor statistics do not allow us to probe accurately this issue.
Best fit results for OverJet, UnderJet and Soft Front.
Best fit results for the jet and Hard Front.
4. Discussion
In this paper we described our study of an Mg-rich jet-like structure detected in the NW area of IC 443 whose emission is mainly due to overionized plasma. The jet projection toward the PWN crosses the position of the NS at the time of the explosion of the progenitor star, strongly indicating that the PWN belongs to IC 443 and that the collimated jet has been produced by the exploding star.
The results of our spatially resolved spectral analysis helped us to imagine a reliable scenario which can explain the observed morphology of the jet region (see Fig. 2.) The molecular cloud has an important role in the dynamical evolution of IC 443. After the SN explosion, ejecta expanded and encountered the molecular cloud which has a density more than 100 times higher (Cornett et al. 1977), representing a wall for the ejecta’s plasma. In particular, the jet cannot pass through the cloud, is distorted and the distorted part is the region we called Hard Front which is the real upper part of the jet. The Soft Front emission is likely due to heating caused by the impact of the jet on the cloud.
The jet of IC 443 is the first structure of this type which clearly presents emission of overionized plasma. Until now other two jets have been inferred by Willingale et al. (2003), Hwang et al. (2004), and Fesen et al. (2006) in Cas A and García et al. (2017) in Vela SNR, but in both cases the plasma is underionized. We investigated possible causes of this overionization and we devised the following scenario.
The authors of M17 studied the distribution of overionized plasma in IC 443 by analyzing a set of Suzaku observations. They found overionized plasma in the region surrounding the PWN, where the ionization parameter is extremely low (τ ≈ 4 × 10¹¹ s cm−3), indicating a plasma very far from conditions of collisional ionization equilibrium (CIE). Instead, they found CIE conditions in the NW jet region (which is very distant from the SE cloud) and concluded that overionization is due to thermal conduction with the cold SE cloud. We here proved that, though a large area of the NW shell is in CIE (i.e. the area in which the ISM emission dominates), the ejecta at NW are overionized. The ejecta in this region are concentrated in the collimated jet that is quite narrow (the thickest part is 1.5′ large) and therefore unresolved by the large PSF of the Suzaku mirrors. We also found that the degree of overionization in the NW jet ( ) is perfectly consistent with that measured by M17 at SE (
 ), see Table 3 of M17). This result seems to exclude that the overionization is due to thermal conduction with the SE cloud and may suggest an adiabatic cooling associated with the expansion of the ejecta. Before the expansion, the ejecta may have been heated by the interaction with a reflected shock due to the impact of the forward shock front with the SE cloud (which is very close to the explosion site, indicated by the original position of the PWN in Fig. 1).
Indeed, we roughly estimated temperature and ionization parameter of the plasma by assuming adiabatic expansion, starting with a temperature of 5 keV, which is the fixed value of kTinit in our best fit with the VAPEC + VRNEI model (see Appendix A for a detailed description). We obtained kT ≈ 0.5 keV and τ ≈ 2 × 10¹¹ s cm−3 which are similar (within a factor of two) to those we measured with the spectral analysis (Table 3). These results further support our dynamical scenario (similar to that proposed for W49B by Zhou et al. 2011) which needs to be confirmed through dedicated hydrodynamic models.
We estimated the mass and the kinetic energy associated with the jet and Hard Front using the best fit values. We obtained M ≈ 0.03 Msun and K ≈ 4 × 1048 erg which are intermediate values between those found by Willingale et al. (2003) and Orlando et al. (2016) for Cas A (M ≈ 0.4 Msun and K ≈ 1049 erg) and those found by García et al. (2017) for the Vela SNR (M ≈ 0.008 Msun and K ≈ 1047 erg). This similarity among all jets detected in core-collapse SNRs suggests that the physical origin of these structures is probably the same but details of the mechanism which cause them are still unknown. Moreover, we and García et al. (2017) found that the jets cross the original position of the NS. It is, then, natural to speculate that this mechanism is somehow related to the core collapse of the progenitor star.
Acknowledgments
We appreciate the comments and suggestions of the referee. M.M., S.O. and G.P. acknowledge financial contribution from the agreement ASI-INAF n.2017-14-H.O.
Such files can be found at XMM ESAC website https://www.cosmos.esa.int/web/xmm-newton/blank-sky
Such files can be found at XMM ESAC website https://www.cosmos.esa.int/web/xmm-newton/filter-closed
References
- Arnaud, K. A. 1996, Astronomical Data Analysis Software and Systems V, eds. G. H. Jacoby & J. Barnes, ASP Conf. Ser. 101, 17 [NASA ADS] [Google Scholar]
- Burton, M. G., Geballe, T. R., Brand, P. W. J. L., & Webster, A. S. 1988, MNRAS, 231, 617 [NASA ADS] [Google Scholar]
- Cornett, R. H., Chin, G., & Knapp, G. R. 1977, A&A, 54, 889 [NASA ADS] [Google Scholar]
- Fesen, R. A., Hammell, M. C., Morse, J., et al. 2006, ApJ, 645, 283 [NASA ADS] [CrossRef] [Google Scholar]
- Gaensler, B. M., Chatterjee, S., Slane, P. O., et al. 2006, ApJ, 648, 1037 [NASA ADS] [CrossRef] [Google Scholar]
- García, F., Suárez, A. E., Miceli, M., et al. 2017, A&A, 604, L5 [NASA ADS] [CrossRef] [EDP Sciences] [Google Scholar]
- Grichener, A., & Soker, N. 2017, MNRAS, 468, 1226 [NASA ADS] [CrossRef] [Google Scholar]
- Hwang, U., Laming, J. M., Badenes, C., et al. 2004, ApJ, 615, L117 [NASA ADS] [CrossRef] [Google Scholar]
- Janka, H.-T., Melson, T., & Summa, A. 2016, Ann. Rev. Nucl. Part. Sci., 66, 341 [NASA ADS] [CrossRef] [Google Scholar]
- Kawasaki, M. T., Ozaki, M., Nagase, F., et al. 2002, ApJ, 572, 897 [NASA ADS] [CrossRef] [Google Scholar]
- Matsumura, H., Tanaka, T., Uchida, H., Okon, H., & Tsuru, T. G. 2017, ApJ, 851, 73 [NASA ADS] [CrossRef] [Google Scholar]
- Miceli, M., Bocchino, F., Decourchelle, A., Ballet, J., & Reale, F. 2010, A&A, 514, L2 [NASA ADS] [CrossRef] [EDP Sciences] [Google Scholar]
- Miceli, M., Bamba, A., Orlando, S., et al. 2017, A&A, 599, A45 [NASA ADS] [CrossRef] [EDP Sciences] [Google Scholar]
- Ohnishi, T., Uchida, H., Tsuru, T. G., et al. 2014, ApJ, 784, 74 [NASA ADS] [CrossRef] [Google Scholar]
- Orlando, S., Miceli, M., Pumo, M. L., & Bocchino, F. 2016, ApJ, 822, 22 [NASA ADS] [CrossRef] [Google Scholar]
- Ozawa, M., Koyama, K., Yamaguchi, H., Masai, K., & Tamagawa, T. 2009, ApJ, 706, L71 [NASA ADS] [CrossRef] [Google Scholar]
- Pavlov, G. G., Teter, M. A., Kargaltsev, O., & Sanwal, D. 2003, ApJ, 591, 1157 [NASA ADS] [CrossRef] [Google Scholar]
- Rho, J., & Petre, R. 1998, ApJ, 503, L167 [NASA ADS] [CrossRef] [Google Scholar]
- Sawada, M., & Koyama, K. 2012, PASJ, 64, 81 [NASA ADS] [CrossRef] [Google Scholar]
- Su, Y., Fang, M., Yang, J., Zhou, P., & Chen, Y. 2014, ApJ, 788, 122 [NASA ADS] [CrossRef] [Google Scholar]
- Swartz, D. A., Pavlov, G. G., Clarke, T., et al. 2015, ApJ, 808, 84 [NASA ADS] [CrossRef] [Google Scholar]
- Troja, E., Bocchino, F., & Reale, F. 2006, ApJ, 649, 258 [NASA ADS] [CrossRef] [Google Scholar]
- Troja, E., Bocchino, F., Miceli, M., & Reale, F. 2008, A&A, 485, 777 [NASA ADS] [CrossRef] [EDP Sciences] [Google Scholar]
- Uchida, H., Koyama, K., Yamaguchi, H., et al. 2012, PASJ, 64, 141 [NASA ADS] [CrossRef] [Google Scholar]
- Welsh, B. Y., & Sallmen, S. 2003, A&A, 408, 545 [NASA ADS] [CrossRef] [EDP Sciences] [Google Scholar]
- Willingale, R., Bleeker, J. A. M., van der Heyden, K. J., & Kaastra, J. S. 2003, A&A, 398, 1021 [NASA ADS] [CrossRef] [EDP Sciences] [Google Scholar]
- Wilson, J.R. 1985, in Numerical Astrophysics, eds. J. Centrella, J. M. Leblanc & R. L. Bowers (Boston: Jones and Bartlett), 422 [Google Scholar]
- Yamaguchi, H., Ozawa, M., Koyama, K., et al. 2009, ApJ, 705, L6 [NASA ADS] [CrossRef] [Google Scholar]
- Zhou, X., Miceli, M., Bocchino, F., Orlando, S., Chen, Y. 2011, MNRAS, 415, 244 [NASA ADS] [CrossRef] [Google Scholar]
Appendix A: kT and τ estimates
We roughly estimated temperature and ionization parameter of jet plasma with the following procedure in order to check whether our dynamical model for the plasma is reasonable. To get overionization one needs to have a hot plasma in CIE followed by a rapid cooling. For a gas in adiabatic expansion  where, in our cases, T2 and V2 ≈ 1056 cm3 are the current temperature and volume of the jet and T1 = 5 keV, V1 are the jet temperature and volume at the time in which the expanding forward shock interacts with the molecular cloud in the south (see Fig. A.1). We assume that the ejecta are heated by the interaction with the molecular cloud in the south. If L1 ≈ 2 pc is the distance between the area of the explosion and the SE cloud and νjet is the velocity expansion (assumed constant) of the jet, then t0 = L1/νjet is the time when the hot ejecta are in CIE, immediately before their expansion. We then wanted to evaluate the volume of the jet at t0 assuming it has a conic shape, as shown in Fig. A.1. Considering the projection (marked with the letter D and long ≈12 pc) of the current jet (which has volume V2) towards the PWN, it was possible to calculate V1 ≈ 1054 cm3 and then T2 ≈ 0.5 keV.
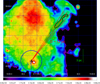 |
Fig. A.1. Count-rate image of IC 443 in the Hard energy band (1.4–5 keV). This is an overview of the scheme used to estimate the volume V1 of the jet at time t 0, namely when the forward shock interacts with the molecular cloud. |
The ionization parameter τ is defined as the time integral of the electron density ne, τ = ∫ nedt. ne is defined as c/V where c = mjet/μprot is the ratio between the jet mass and the average atomic mass μprot = 2.1 * 10−24 g and V is the volume occupied by the plasma. Thanks to the assumption of conic shape for the current jet it is possible to write V = V1 + αt3 where  which gives τ ≈ 2 × 10¹¹ s cm−3 and kT2 ≈ 0.5 keV. These values, similar to those measured through the spatially resolved spectral analysis, further confirm the goodness of our scenario.
All Tables
All Figures
|
Fig. 1. Background-subtracted and vignetting-corrected count-rate images of IC 443 in the Hard band (1.4–5 keV) obtained by combining all the EPIC cameras. The image is adaptively smoothed to a signal-to-noise ratio of 25, the bin size is 6″ and the color scale is logarithmic. In the upper panel, the black box marks the PWN (and the field of view of Fig. 3), the black arrows marks the proper motion of the PWN, the black cross indicates the original position of the PWN (immediately after the explosion) and the white contours traces the molecular cloud as reported by Burton et al. (1988). In the lower panel, the cyan box marks the jet (and the field of view of Fig. 2), the dashed black line is the projection of the jet toward the PWN and the dashed red box is the FOV of the insert in the lower panel. This close-up view shows a detail of the PWN area with the original position and proper motion marked by the black cross and black arrow, respectively. |
| In the text | |
|
Fig. 2. Close-up view of the jet area marked by the cyan box in Fig. 1 in the Soft band (0.5–1.4 keV, top) and in the Hard band (1.4–5 keV, bottom). The image is adaptively smoothed to a signal-to-noise ratio 25, the bin size is 6″ and the color scale is logarithmic. Jet region is marked in black, Soft Front and Hard Front are marked in dashed black, background region in dashed red and OverJet and UnderJet regions in red. |
| In the text | |
|
Fig. 3. Chandra image of the area near the PWN which provides a comparison between the SNR and the PWN jets in the 0.5–7 keV energy band. The image is smoothed with a Gaussian with σ = 2 pixel, the pixel size is 0.246″ and the color scale is linear. The projection of the jet has been shifted on the PWN in order to compare the two jets’ direction. |
| In the text | |
|
Fig. 4. Upper panel: EPIC spectra of the OverJet region obtained simultaneously fitting spectra from six cameras with a VAPEC model (best fit parameters can be found in Table 2). Lower panel: same as is the upper one but for the Jet region described with a VAPEC + VRNEI model (best fit parameters can be found in Table 3). |
| In the text | |
|
Fig. 5. EPIC PN spectrum of the jet extracted from observation 0114100501 showing two different components of the VAPEC + VRNEI model. In the lower panel residuals are displayed. |
| In the text | |
|
Fig. A.1. Count-rate image of IC 443 in the Hard energy band (1.4–5 keV). This is an overview of the scheme used to estimate the volume V1 of the jet at time t 0, namely when the forward shock interacts with the molecular cloud. |
| In the text | |
Current usage metrics show cumulative count of Article Views (full-text article views including HTML views, PDF and ePub downloads, according to the available data) and Abstracts Views on Vision4Press platform.
Data correspond to usage on the plateform after 2015. The current usage metrics is available 48-96 hours after online publication and is updated daily on week days.
Initial download of the metrics may take a while.