Fig. 2.
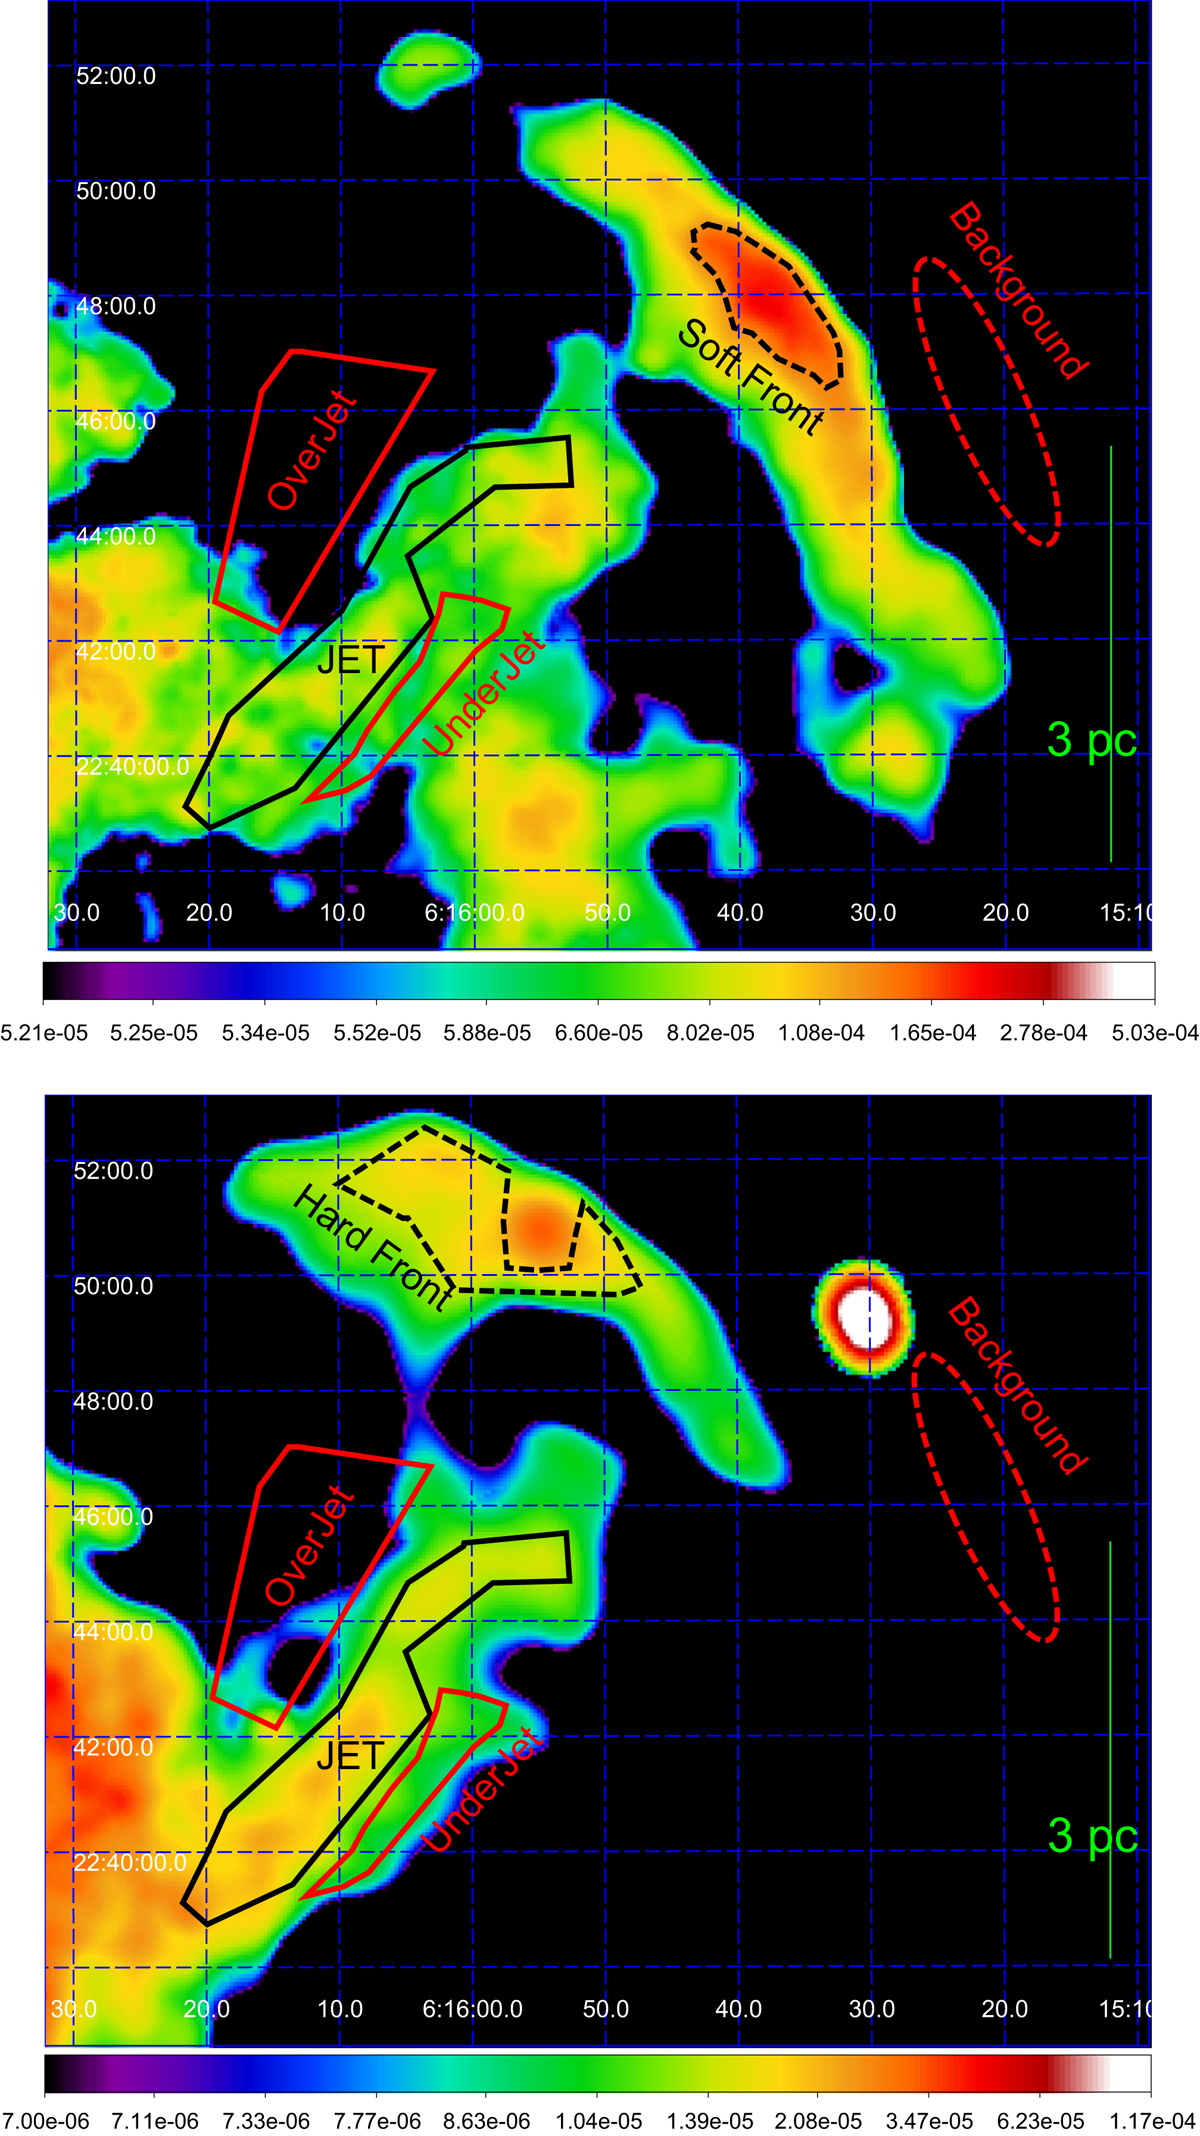
Close-up view of the jet area marked by the cyan box in Fig. 1 in the Soft band (0.5–1.4 keV, top) and in the Hard band (1.4–5 keV, bottom). The image is adaptively smoothed to a signal-to-noise ratio 25, the bin size is 6″ and the color scale is logarithmic. Jet region is marked in black, Soft Front and Hard Front are marked in dashed black, background region in dashed red and OverJet and UnderJet regions in red.
Current usage metrics show cumulative count of Article Views (full-text article views including HTML views, PDF and ePub downloads, according to the available data) and Abstracts Views on Vision4Press platform.
Data correspond to usage on the plateform after 2015. The current usage metrics is available 48-96 hours after online publication and is updated daily on week days.
Initial download of the metrics may take a while.