Fig. 7.
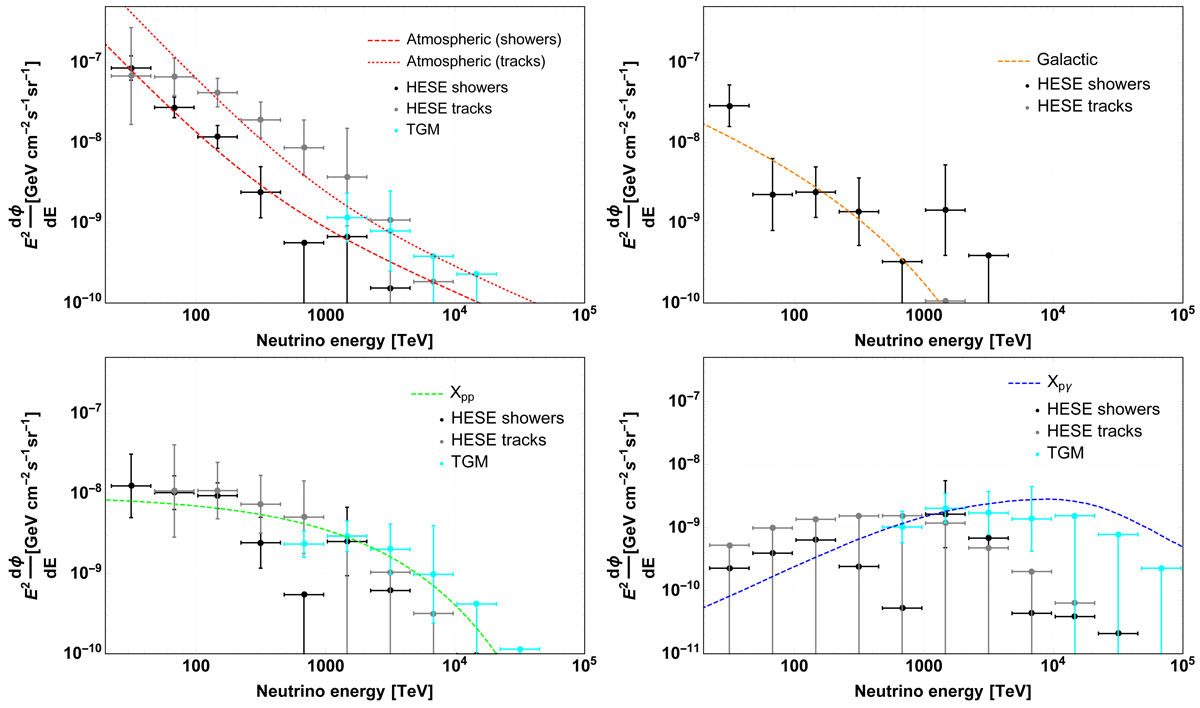
Best-fit model (curves, for track best-fit in Table 2) and unfolded IceCube energy spectrum (points with error bars) for HESE showers, HESE tracks, and TGMs using the method described in Appendix A. Here the data points and error bars are shown for the individual contributions given by the different components, i.e., they depend on the event splitting as given by the fit of the multi-component model.
Current usage metrics show cumulative count of Article Views (full-text article views including HTML views, PDF and ePub downloads, according to the available data) and Abstracts Views on Vision4Press platform.
Data correspond to usage on the plateform after 2015. The current usage metrics is available 48-96 hours after online publication and is updated daily on week days.
Initial download of the metrics may take a while.