Fig. 2.
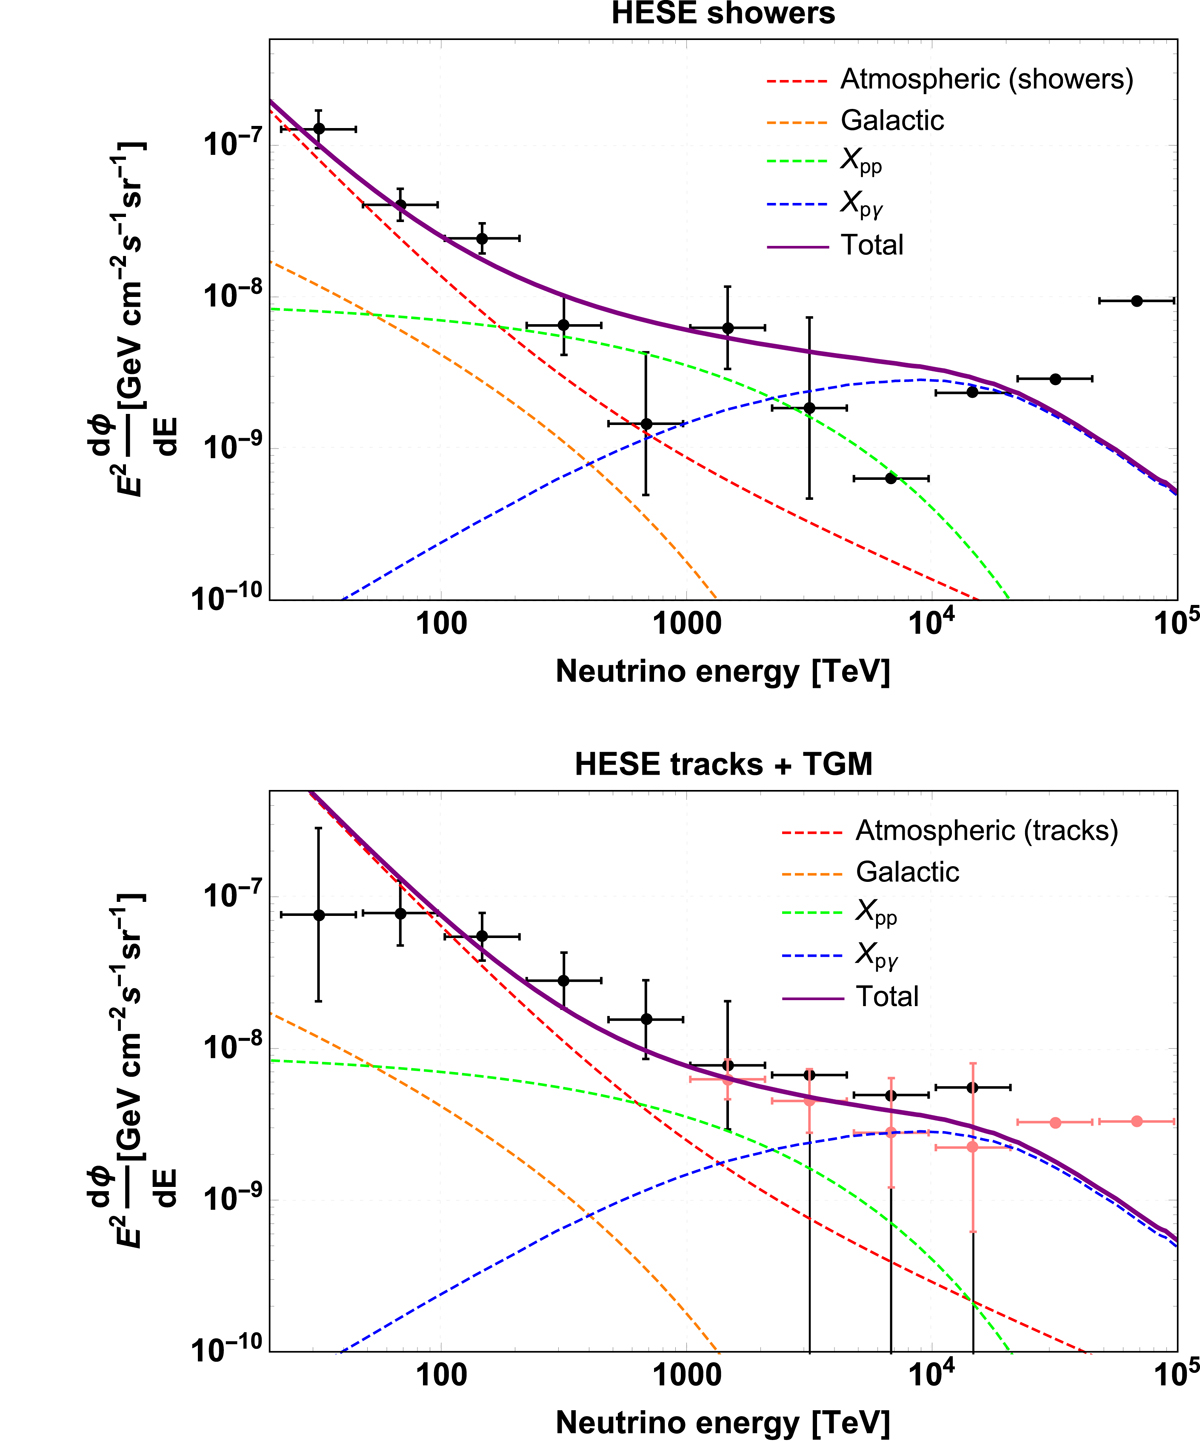
Best-fit model (curves) and unfolded IceCube energy spectrum (points with error bars) for showers (upper panel) and tracks (lower panel) using our method described in Appendix A, where the best fit for tracks in Table 2 has been used. Black dots (and error bars) refer to HESE data and pink/light dots (and error bars) to TGM, which contains the 4.5 PeV reconstructed energy track. The energy scale refers to reconstructed neutrino energy (data) and incident energy (model). The different contributions (and the total) for the multi-component model are shown, as indicated in the plot legends. Compared to the IceCube analysis, the residual atmospheric background is shown explicitly both in data and model.
Current usage metrics show cumulative count of Article Views (full-text article views including HTML views, PDF and ePub downloads, according to the available data) and Abstracts Views on Vision4Press platform.
Data correspond to usage on the plateform after 2015. The current usage metrics is available 48-96 hours after online publication and is updated daily on week days.
Initial download of the metrics may take a while.