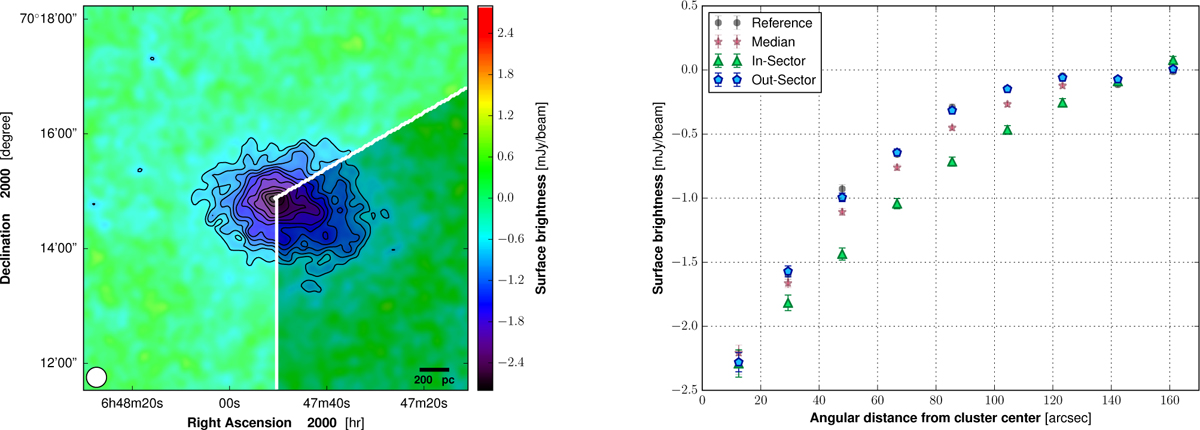
Fig. 6

Left:NIKA2 tSZ surface brightness map at 150 GHz after the subtraction of the submillimeter point source contaminant. The best circular sector, which encloses the over-pressure region within PSZ2 G144.83+25.11, is darkened and delimited by the white lines. Right: tSZ surface brightness profiles computed inside (green) and outside (blue) the dark sector shown in the left panel. The inner and outer radii of the mask are defined by the region where the two profiles are significantly different. The reference profile computed in the north-east quarter of the NIKA2 150 GHz map is shown in black and the median profile computed on the whole map is represented in red.
Current usage metrics show cumulative count of Article Views (full-text article views including HTML views, PDF and ePub downloads, according to the available data) and Abstracts Views on Vision4Press platform.
Data correspond to usage on the plateform after 2015. The current usage metrics is available 48-96 hours after online publication and is updated daily on week days.
Initial download of the metrics may take a while.


