Open Access
Fig. 1
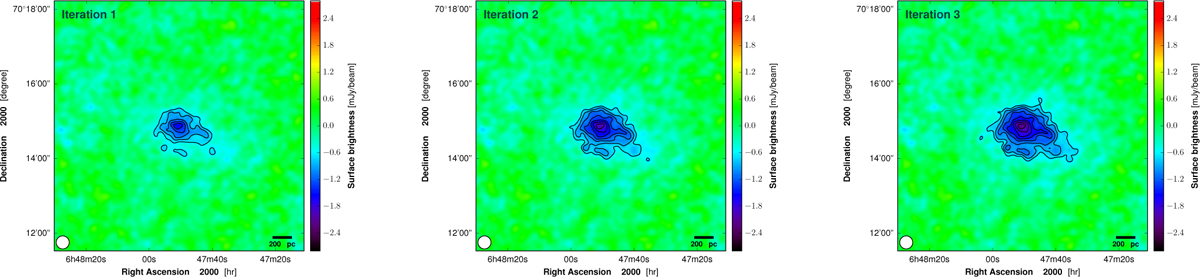
NIKA2 tSZ surface brightness maps at 150 GHz at the end of the first three iterations of the map-making. The black contours give the significance of the measured signal starting at 3σ with 1σ spacing. The color range is the same as the one used in top left panel of Fig. 2.
Current usage metrics show cumulative count of Article Views (full-text article views including HTML views, PDF and ePub downloads, according to the available data) and Abstracts Views on Vision4Press platform.
Data correspond to usage on the plateform after 2015. The current usage metrics is available 48-96 hours after online publication and is updated daily on week days.
Initial download of the metrics may take a while.