Fig. 11
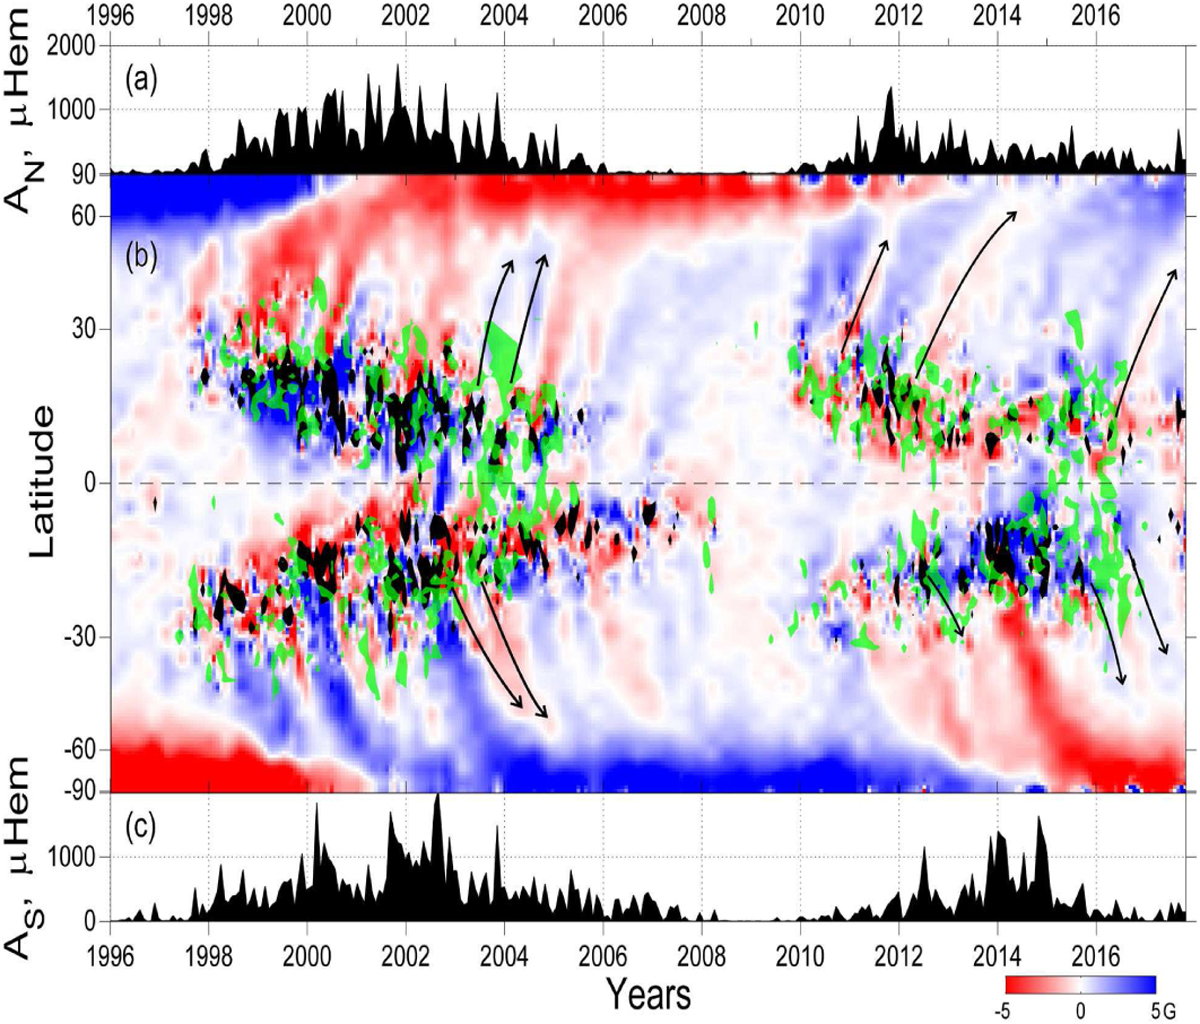
Sunspot areas for the northern (a) and southern (c) solar hemispheres, respectively, in the two latest activity cycles. Panel b: time-latitude diagram of the large-scale radial field. Domains of active regions with non-Joy tilts and regions of intense sunspot activity are overplotted in green and black, respectively. Arrows show the leading-polarity surges.
Current usage metrics show cumulative count of Article Views (full-text article views including HTML views, PDF and ePub downloads, according to the available data) and Abstracts Views on Vision4Press platform.
Data correspond to usage on the plateform after 2015. The current usage metrics is available 48-96 hours after online publication and is updated daily on week days.
Initial download of the metrics may take a while.