Table 1
Description of experimental set-ups with nonconstant noise variance.
| No. | Form of noise | Type of sampling |
|---|---|---|
| 1 | ti ~Uniform(0, T) | |
| 2 | 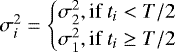 |
ti ~Uniform(0, T) |
| 3 | ||
| Based on MW dataset | ||
Notes. Thefirst column indicates the number of the set-up, the second column shows how the variance ![]() for ith data point was selected, and third column the criteria of drawing the time moment ti for ith data point. In the 3rd row, the
for ith data point was selected, and third column the criteria of drawing the time moment ti for ith data point. In the 3rd row, the ![]() denotes the empirical variance of the ith datapoint and
denotes the empirical variance of the ith datapoint and ![]() and
and ![]() the minimum and maximum intra-seasonal variances. In other words, we renormalised the intra-seasonal variances to the interval from
the minimum and maximum intra-seasonal variances. In other words, we renormalised the intra-seasonal variances to the interval from![]() and
and
![]() .
.
Current usage metrics show cumulative count of Article Views (full-text article views including HTML views, PDF and ePub downloads, according to the available data) and Abstracts Views on Vision4Press platform.
Data correspond to usage on the plateform after 2015. The current usage metrics is available 48-96 hours after online publication and is updated daily on week days.
Initial download of the metrics may take a while.