Fig. 5
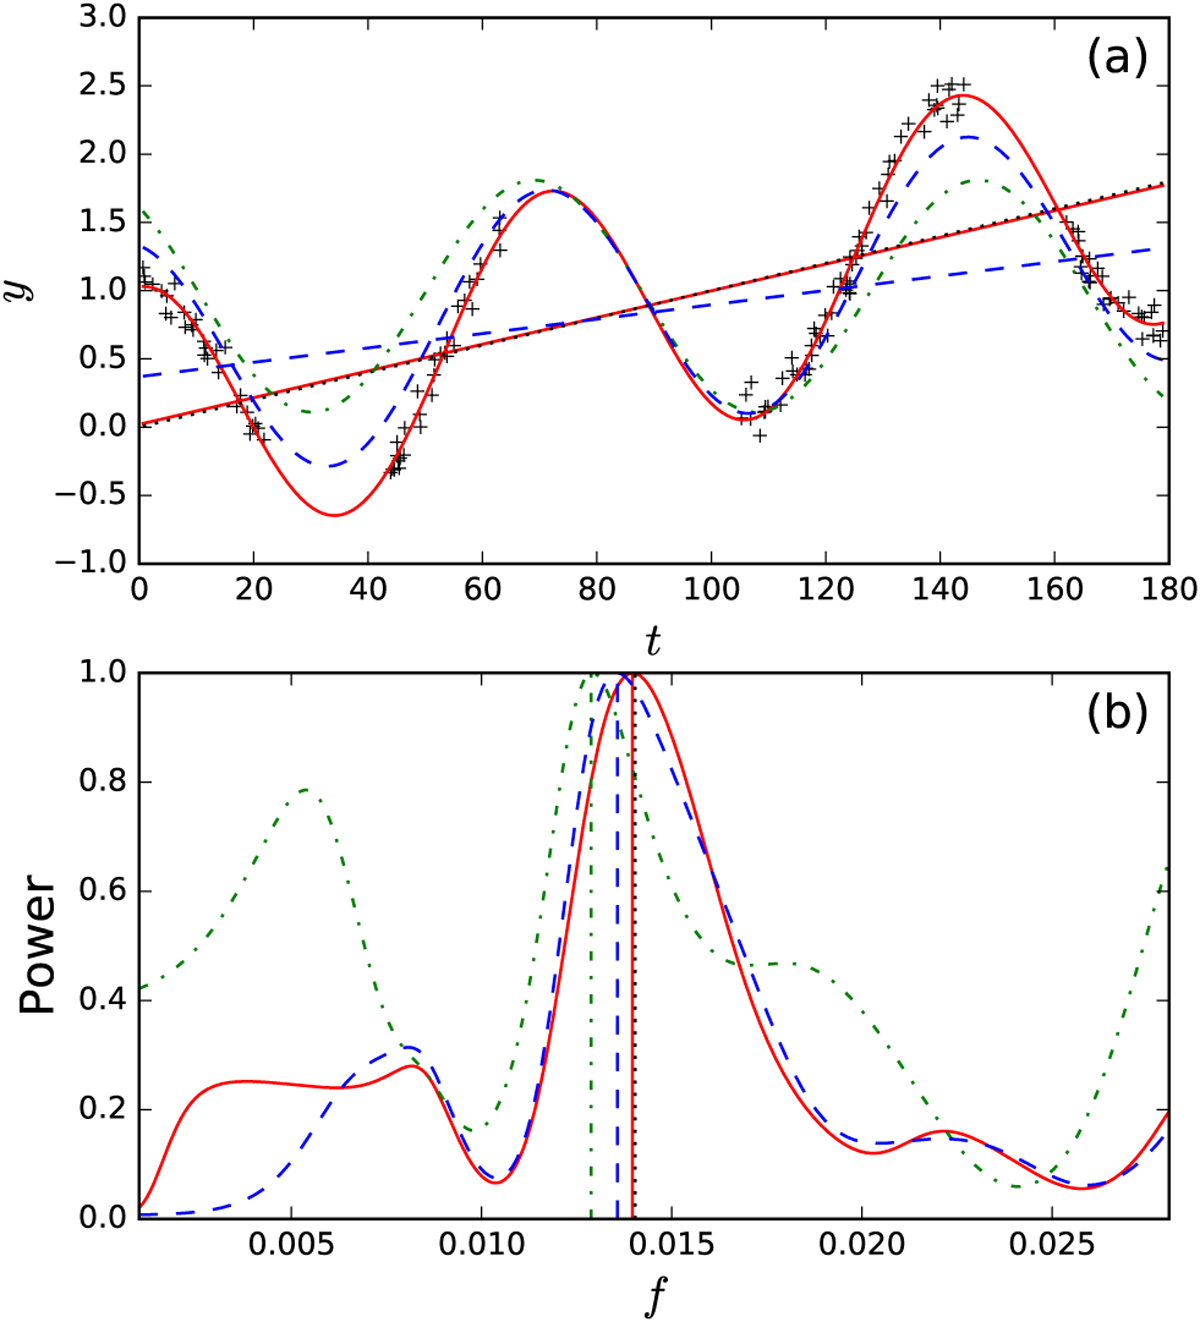
Comparison of the results using various models. The true model of the data contains one harmonic, a trend, and additive white Gaussian noise. Panel a: Data (black crosses), BGLST model (red continuous curve), GLS-T model (blue dashed curve), GLS model (green dash-dotted curve), true trend (black dotted line), trend from BGLST model (red continuous line), and empirical trend (blue dashed line) are shown. Panel b: spectra of the corresponding models with vertical lines indicating the locations of maxima. The black dotted line shows the position of the true frequency.
Current usage metrics show cumulative count of Article Views (full-text article views including HTML views, PDF and ePub downloads, according to the available data) and Abstracts Views on Vision4Press platform.
Data correspond to usage on the plateform after 2015. The current usage metrics is available 48-96 hours after online publication and is updated daily on week days.
Initial download of the metrics may take a while.