Free Access
Fig. 2
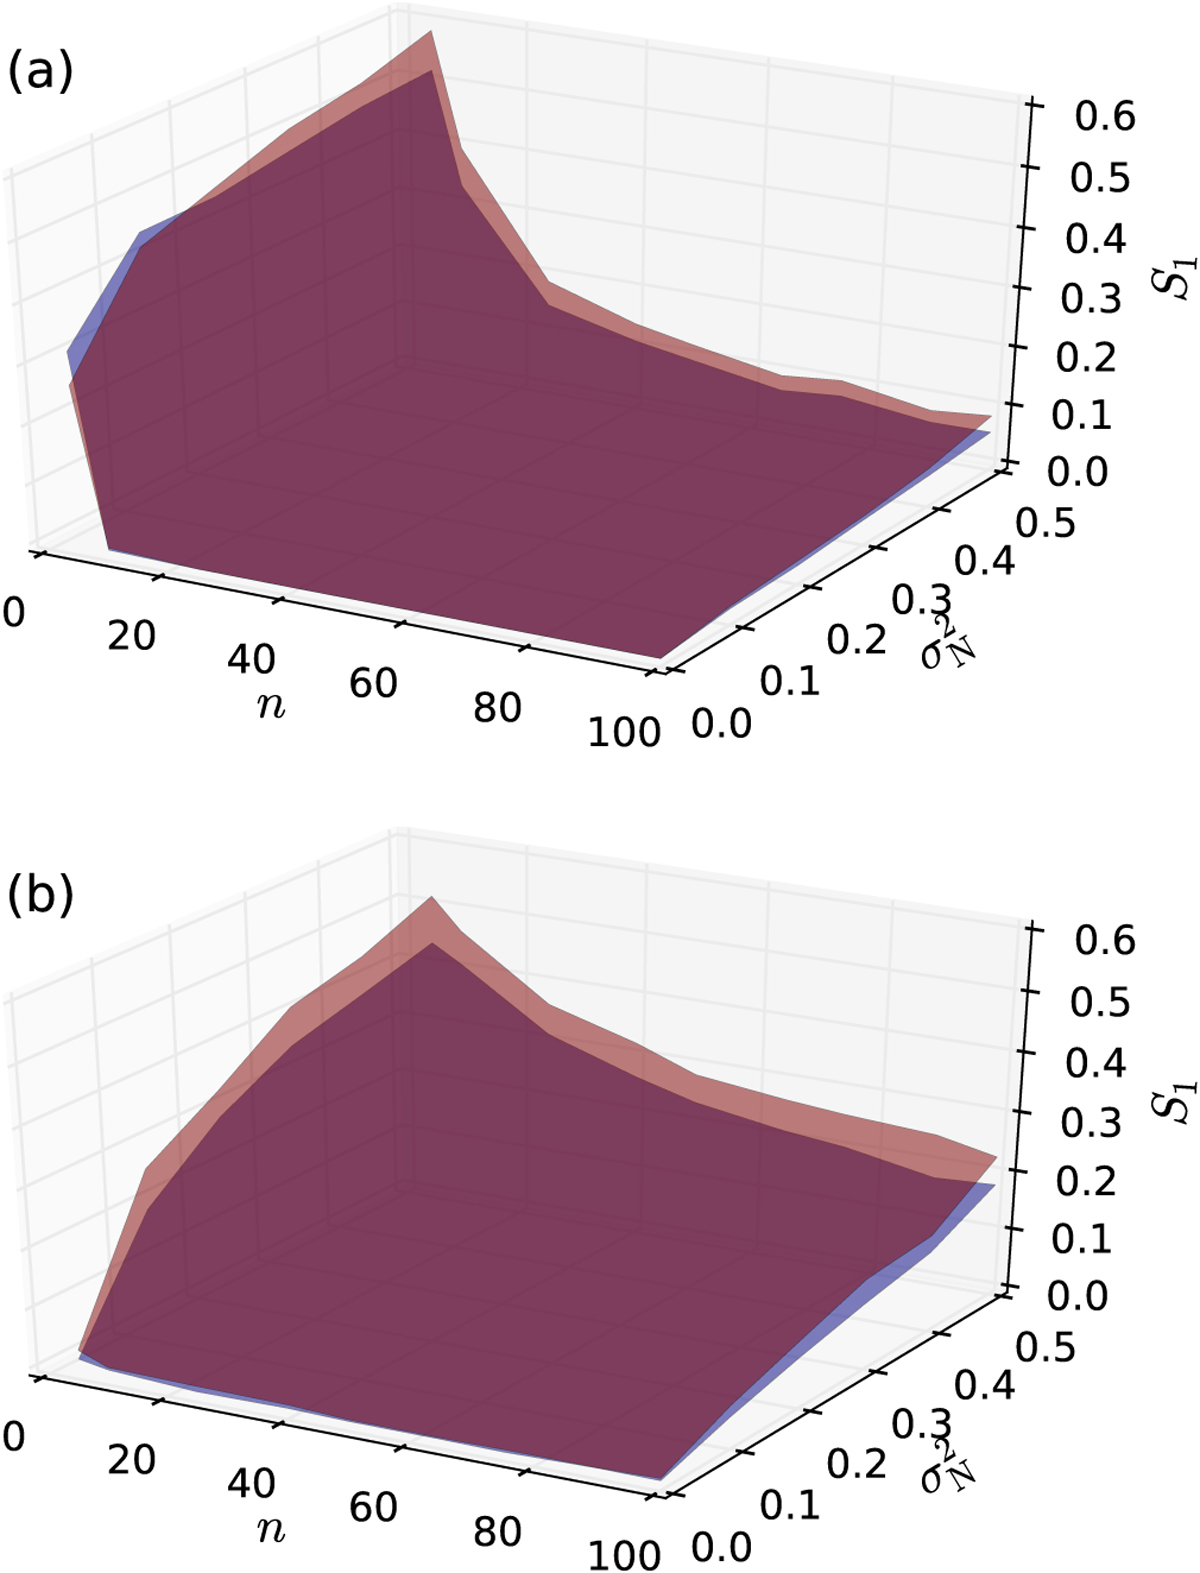
Performance measure S1 of BGLST (red) and GLS (blue) methods as a function of the number of data points n and noise variance ![]() . Uniform sampling (panel a) and sampling with segments and gaps are shown (panel b). For the definition of S1, see text.
. Uniform sampling (panel a) and sampling with segments and gaps are shown (panel b). For the definition of S1, see text.
Current usage metrics show cumulative count of Article Views (full-text article views including HTML views, PDF and ePub downloads, according to the available data) and Abstracts Views on Vision4Press platform.
Data correspond to usage on the plateform after 2015. The current usage metrics is available 48-96 hours after online publication and is updated daily on week days.
Initial download of the metrics may take a while.