Fig. 4
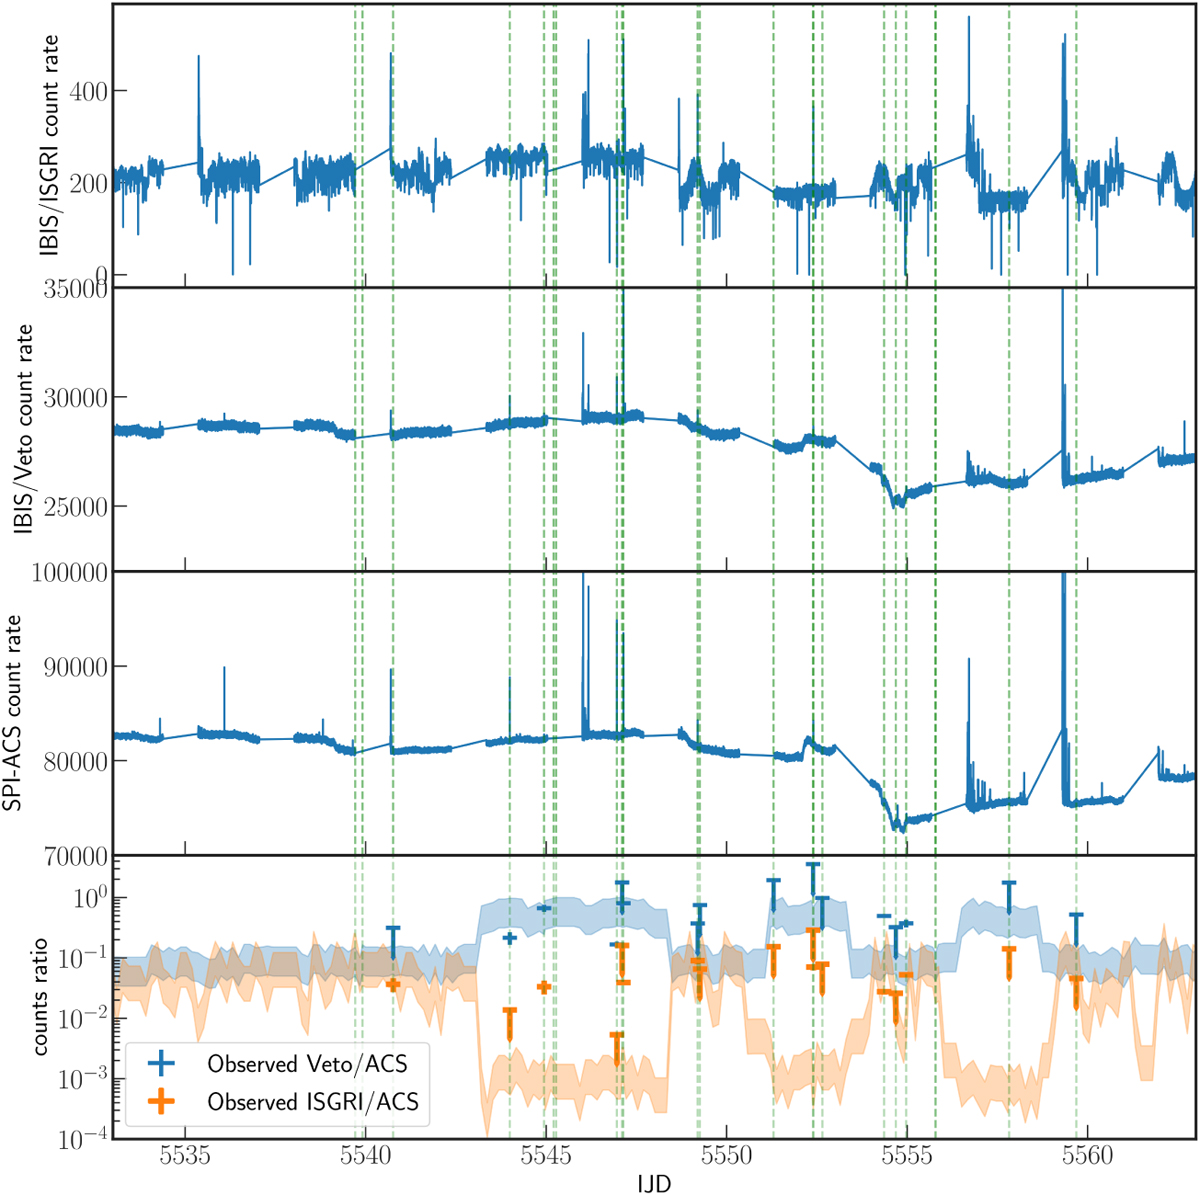
INTEGRAL response to the nova V5668 Sgr. Top three panels: measured counts rates of different instruments aboard INTEGRAL in 100 s time bins (blue data points). From top to bottom: IBIS/ISGRI, IBIS/Veto, and SPI-ACS. Bottom panel: count ratios between the Veto and the ACS (blue), and ISGRI and the ACS (orange) if a source at the position of V5668 exposed INTEGRAL with a nova-like spectrum. The blue and red data points mark the actually measured ratios during the 23 event times (vertical dashed green lines). See text for details.
Current usage metrics show cumulative count of Article Views (full-text article views including HTML views, PDF and ePub downloads, according to the available data) and Abstracts Views on Vision4Press platform.
Data correspond to usage on the plateform after 2015. The current usage metrics is available 48-96 hours after online publication and is updated daily on week days.
Initial download of the metrics may take a while.