Fig. 3
Light curves of the gamma-ray lines at 429 keV (![]() , panel a), 478 keV (
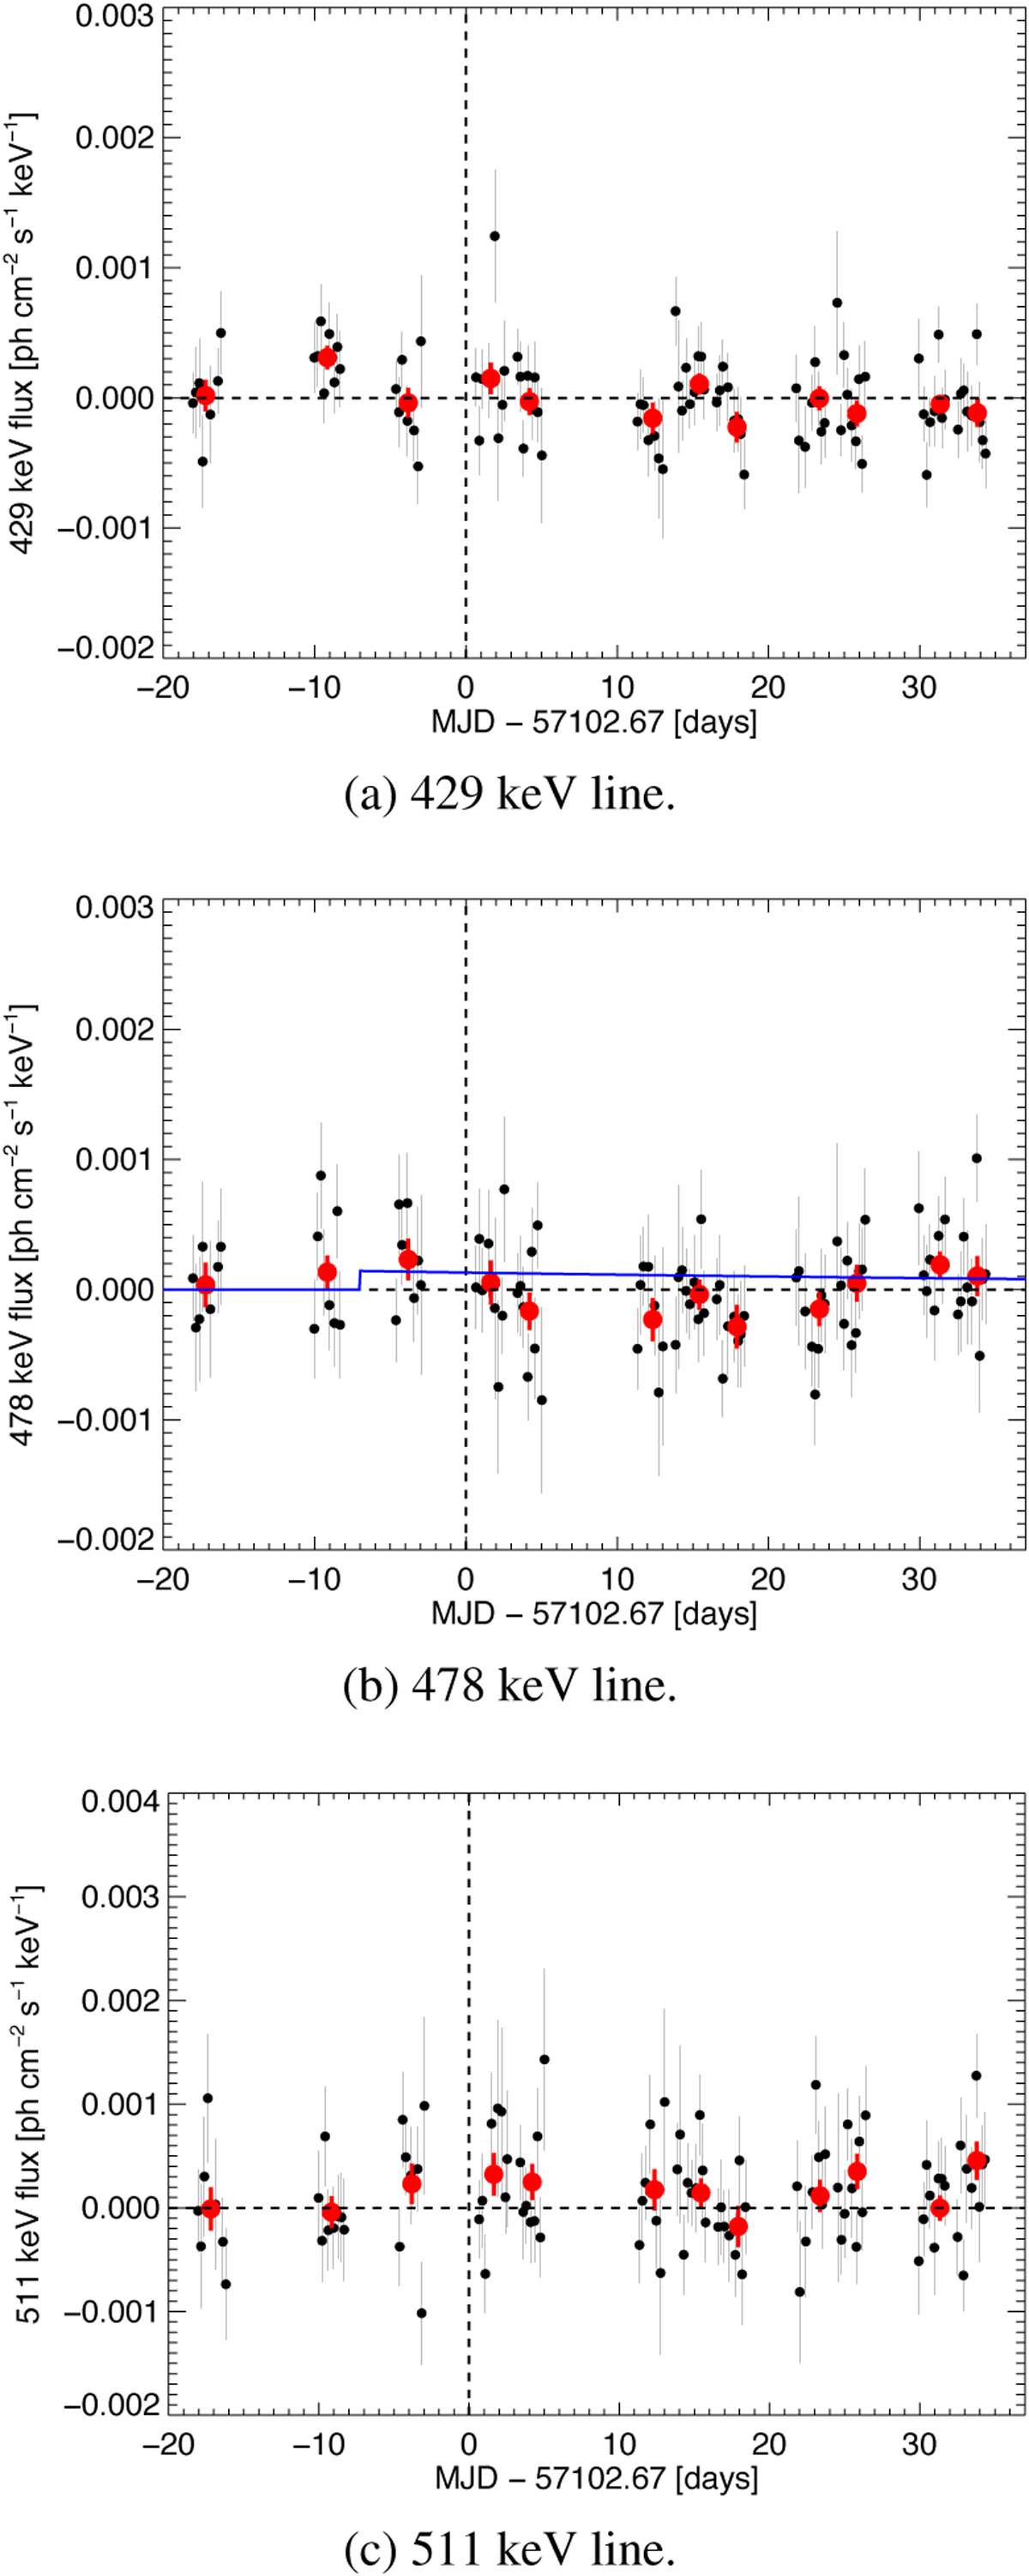
, panel a), 478 keV (![]() , panel b), and511 keV (e+ + e−→ γ + γ, panel c). Shown are measured flux values in the energy bands 425–433 keV, 475–483 keV, and 506–516 keV, respectively, for 2–3 h time bins (black dots), and ≈ 2-day intervals (red dots), with respect to the optical maximum at T0 = MJD 57102.67 (vertical dashed line). The zero flux levels are indicated by a horizontal dashed line. No significant excess (> 3σ) is found during the observations. In order to derive an upper limit on the flux from the decay of 7Be, an exponential radioactive decay law has been fitted to the data points. As the true time of explosive burning of V5668 is not known, a canonical time offset of Δ t = − 7 d is used. The 3σ upper limit on this decay law is shown as solid blue line in panel b. An upper limit on the annihilation flux at that time is not possible as INTEGRAL was pointed away from the source. See text for more details.
, panel b), and511 keV (e+ + e−→ γ + γ, panel c). Shown are measured flux values in the energy bands 425–433 keV, 475–483 keV, and 506–516 keV, respectively, for 2–3 h time bins (black dots), and ≈ 2-day intervals (red dots), with respect to the optical maximum at T0 = MJD 57102.67 (vertical dashed line). The zero flux levels are indicated by a horizontal dashed line. No significant excess (> 3σ) is found during the observations. In order to derive an upper limit on the flux from the decay of 7Be, an exponential radioactive decay law has been fitted to the data points. As the true time of explosive burning of V5668 is not known, a canonical time offset of Δ t = − 7 d is used. The 3σ upper limit on this decay law is shown as solid blue line in panel b. An upper limit on the annihilation flux at that time is not possible as INTEGRAL was pointed away from the source. See text for more details.
Current usage metrics show cumulative count of Article Views (full-text article views including HTML views, PDF and ePub downloads, according to the available data) and Abstracts Views on Vision4Press platform.
Data correspond to usage on the plateform after 2015. The current usage metrics is available 48-96 hours after online publication and is updated daily on week days.
Initial download of the metrics may take a while.