Fig. 2
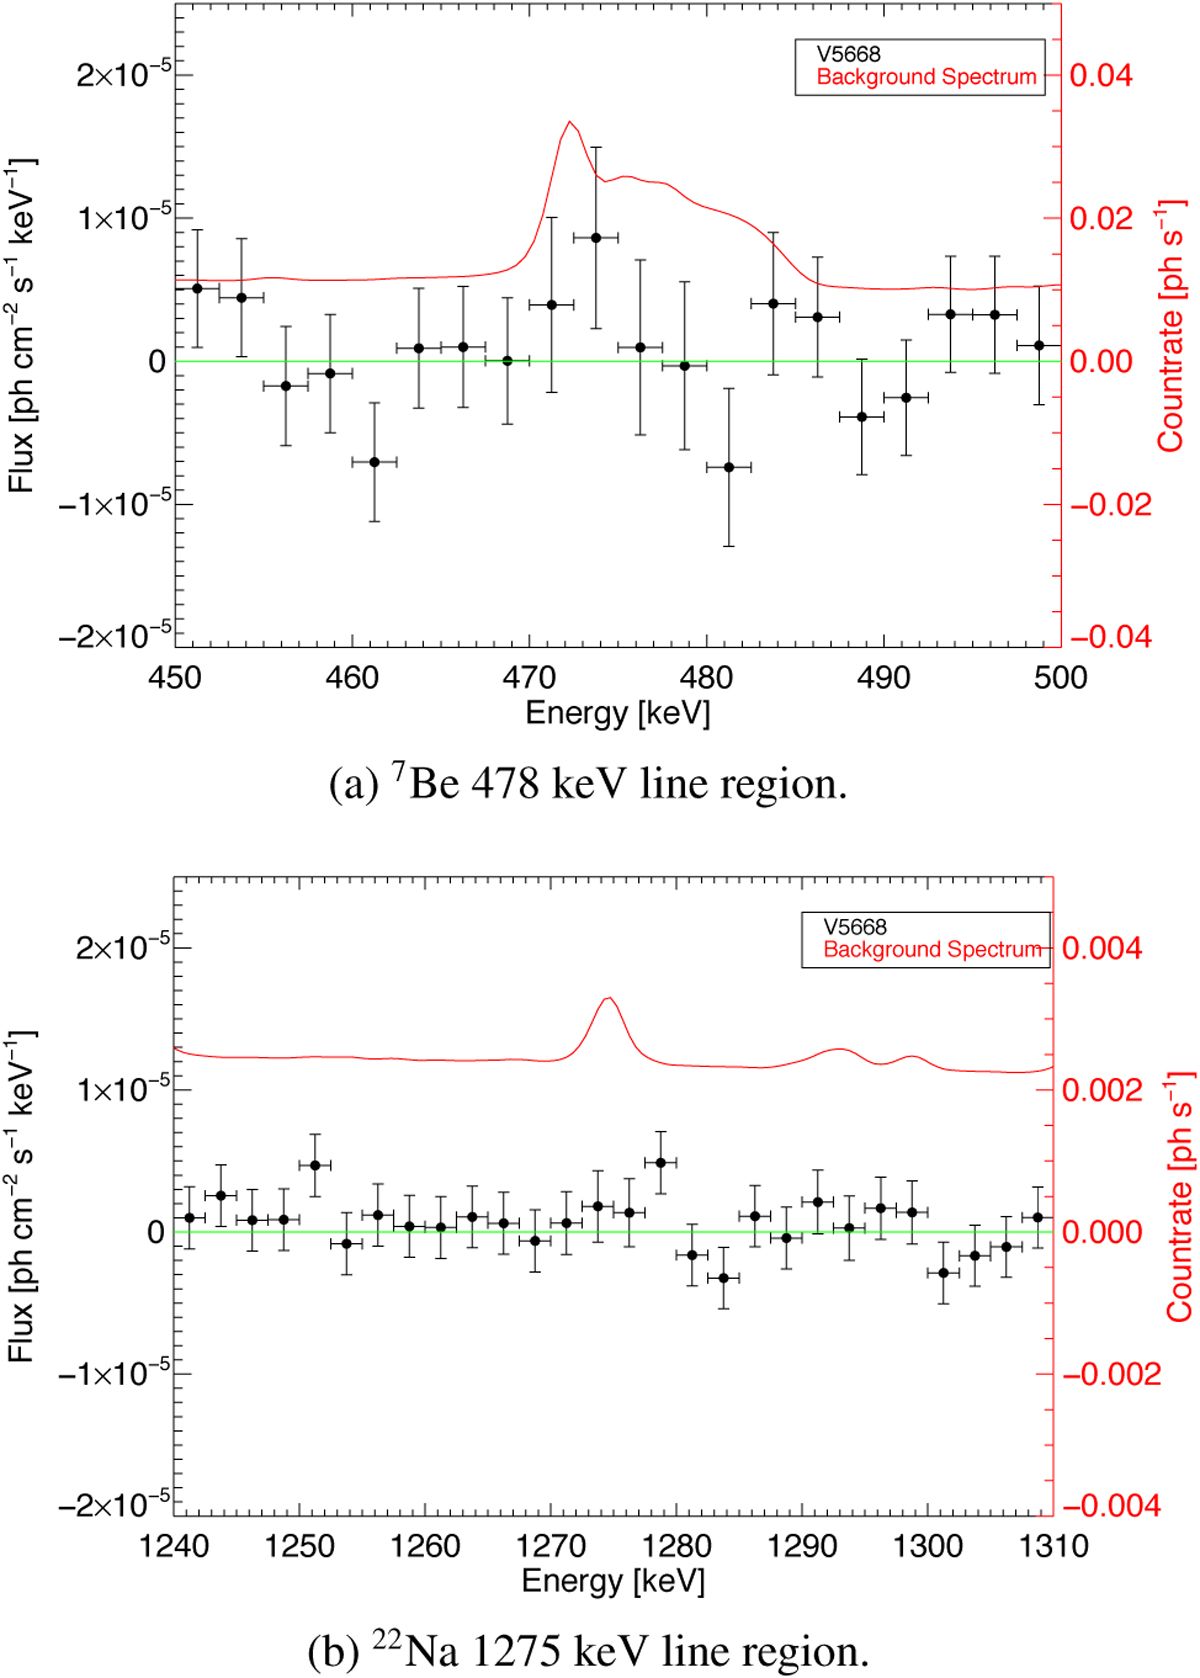
Spectra (black data points, left-hand axes, 2.5 keV binning) for V5668, integrated between days –7 and +37 after the optical maximum. Also shown are the SPI background spectra (red, right-hand axes) in the energy range 450–500 keV (panel a) and 1240–1310 keV (panel b). The background is well suppressed, and no significant line-like or continuum excesses above background can be identified. The zero-flux level is indicated by green solid lines. See text for details.
Current usage metrics show cumulative count of Article Views (full-text article views including HTML views, PDF and ePub downloads, according to the available data) and Abstracts Views on Vision4Press platform.
Data correspond to usage on the plateform after 2015. The current usage metrics is available 48-96 hours after online publication and is updated daily on week days.
Initial download of the metrics may take a while.