Fig. 4
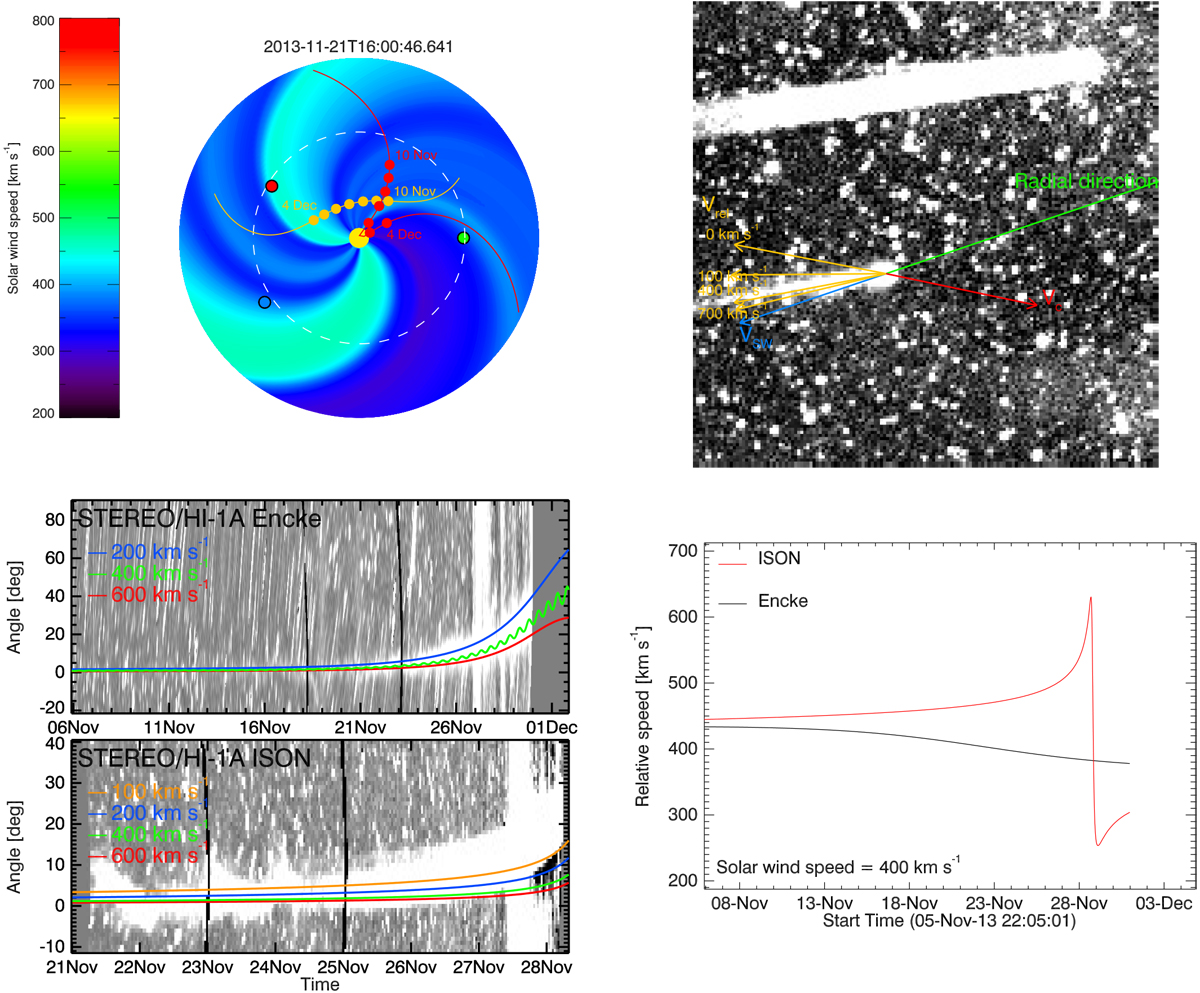
Top left panel: solar wind speed on the solar equatorial plane provided by ENLIL. Earth’s position is fixed and represented by a green dot, while STEREO A and B are shown with red and blue dots, respectively. The trajectories of Encke and ISON projected on this plane are shown in orange and red, respectively, with some dots showing the positions of the comets with an interval of four days between 10 Nov and 4 Dec. The corresponding movie is available online. Top right panel: projected radial direction from the Sun, the projected direction of the orbital speed for Encke (red), and the resulting vectors V (yellow) determined as a vectorial sum between the solar wind VSW and the comet speed VC vectors. For a solar wind speed of 400 km s−1, the projected direction of V almost coincides with the tail direction. Bottom left panels: time-distance maps for Encke and ISON showing the inclination of the tail (the bright feature) with respect to the projected radial direction, and compared for different profiles of the aberration angle. In one case, we show the behaviour of the aberration angle profile for Encke assuming a sinusoidally variable solar wind with mean value of 400 km s−1, amplitude of 50 km s−1, and period of 12 h. Bottom right panel: plot of the relative speed magnitude V vs. time of observations assuming a constant and radial solar wind speed of 400 km s−1.
Current usage metrics show cumulative count of Article Views (full-text article views including HTML views, PDF and ePub downloads, according to the available data) and Abstracts Views on Vision4Press platform.
Data correspond to usage on the plateform after 2015. The current usage metrics is available 48-96 hours after online publication and is updated daily on week days.
Initial download of the metrics may take a while.