Fig. 1
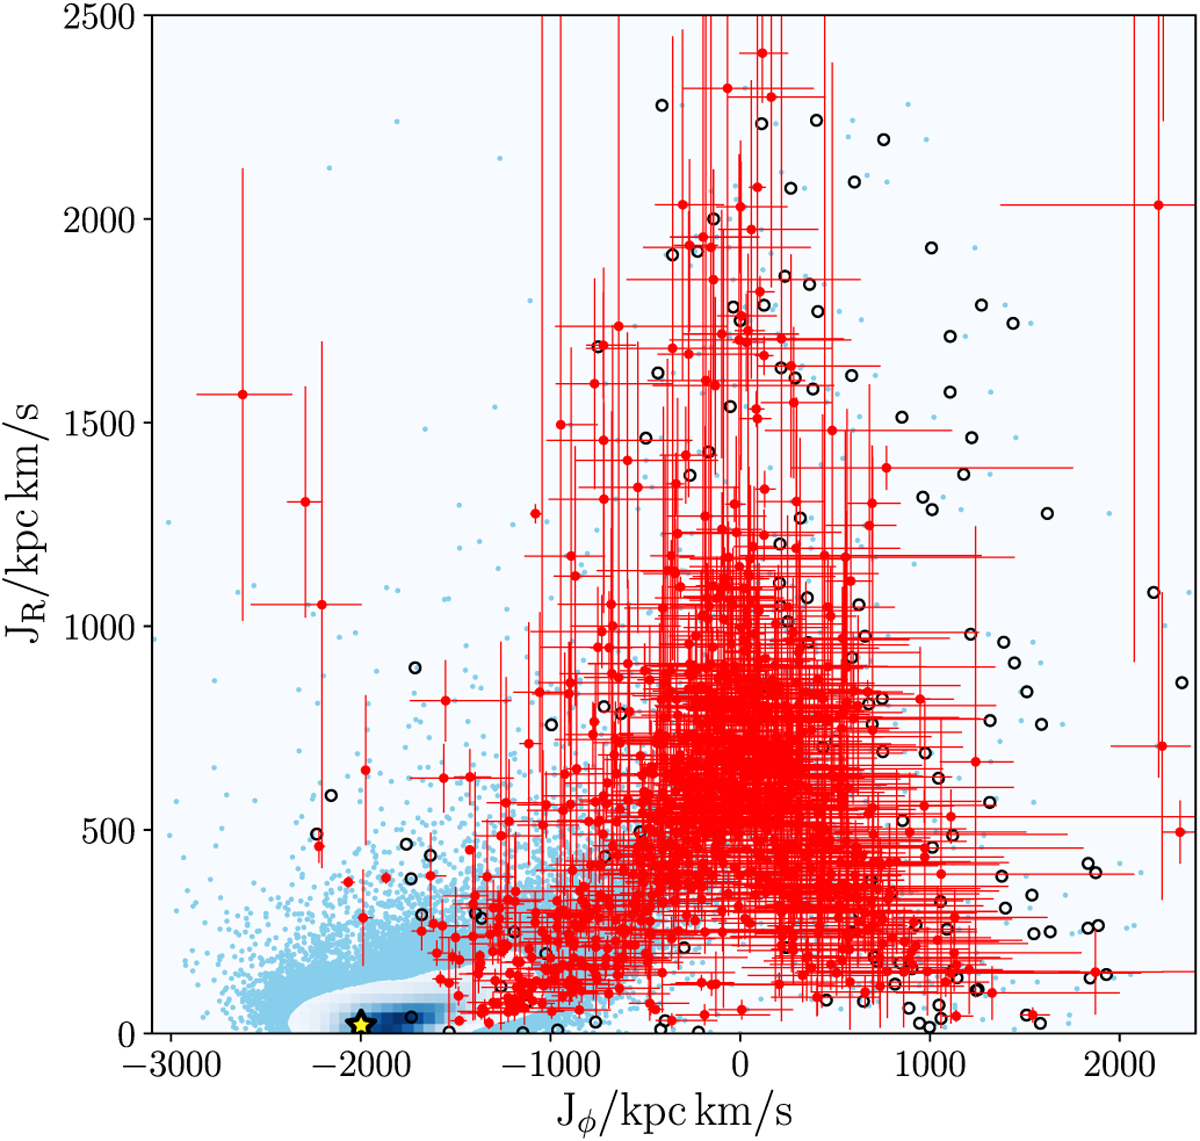
Distribution of halo stars (red filled circles) in the angular momentum-radial action space. For comparison, we also plot all the stars in the sample (mostly disc stars) with cyan symbols and with a histogram of point density in the crowded region where orbits are nearly circular (JR ~ 0, Jϕ ~ J⊙). The cyan points at large JR and/or at small or retrograde Jϕ, although located in the region where the halo dominates, in practice have uncertainties that are too large and thus fail to pass the criterion given by Eq. (11); they are therefore not part of the dynamically selected halo. The yellow star marks the position of the Sun in this diagram. We show 16th–84th percentile error bars, computed as in Sect. 3.4, for all the halo stars with fractional error on JR smaller than 90%; instead, we plot as black empty circles the other halo stars for visualization purposes.
Current usage metrics show cumulative count of Article Views (full-text article views including HTML views, PDF and ePub downloads, according to the available data) and Abstracts Views on Vision4Press platform.
Data correspond to usage on the plateform after 2015. The current usage metrics is available 48-96 hours after online publication and is updated daily on week days.
Initial download of the metrics may take a while.