Fig. 7.
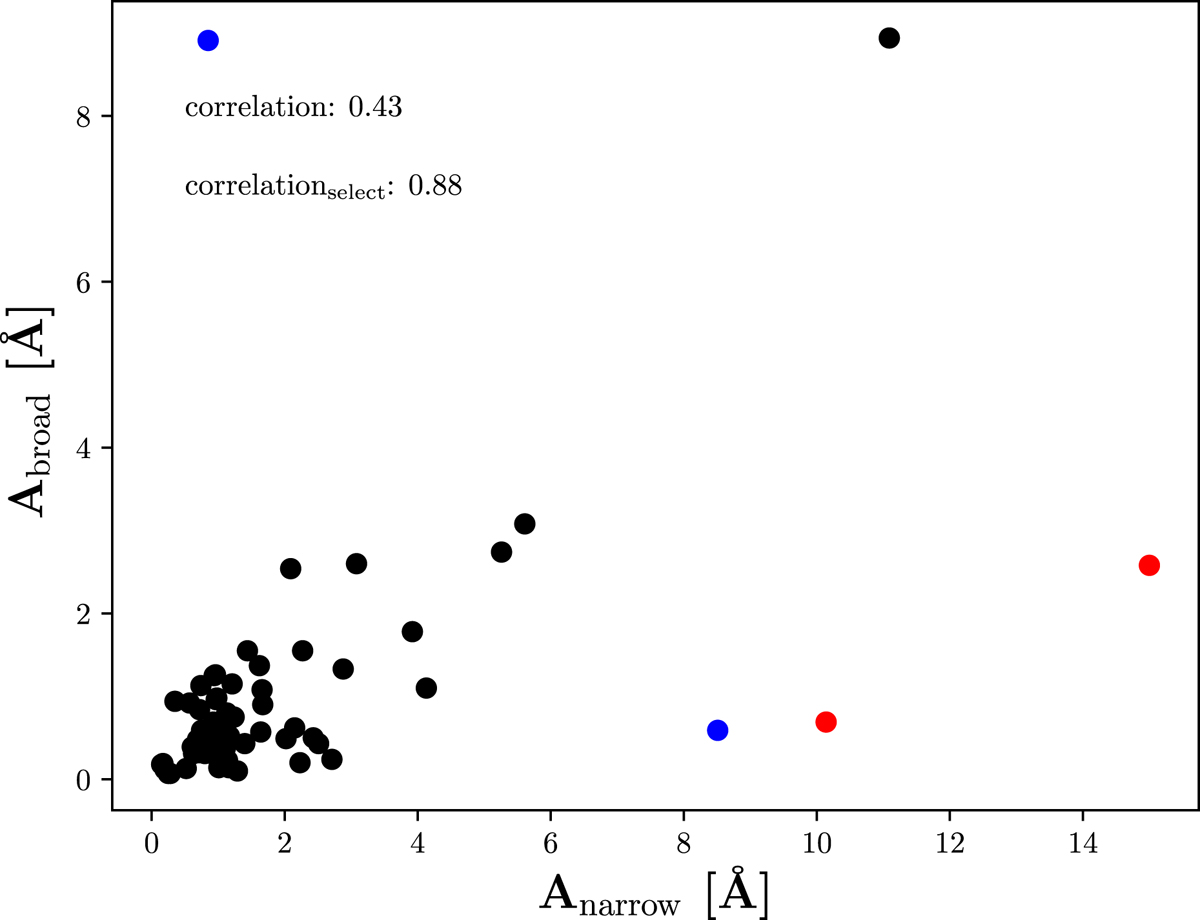
Hα line residual pEW(Hα) in the broad component versus the narrow residual pEW(Hα) both measured by the Gaussian area, A, of the line fit. Red dots correspond to the two values for CN Leo and blue dots to the two values for vB 8. Correlation coefficients correspond to the whole sample and the sample excluding CN Leo and vB 8.
Current usage metrics show cumulative count of Article Views (full-text article views including HTML views, PDF and ePub downloads, according to the available data) and Abstracts Views on Vision4Press platform.
Data correspond to usage on the plateform after 2015. The current usage metrics is available 48-96 hours after online publication and is updated daily on week days.
Initial download of the metrics may take a while.