Fig. 14.
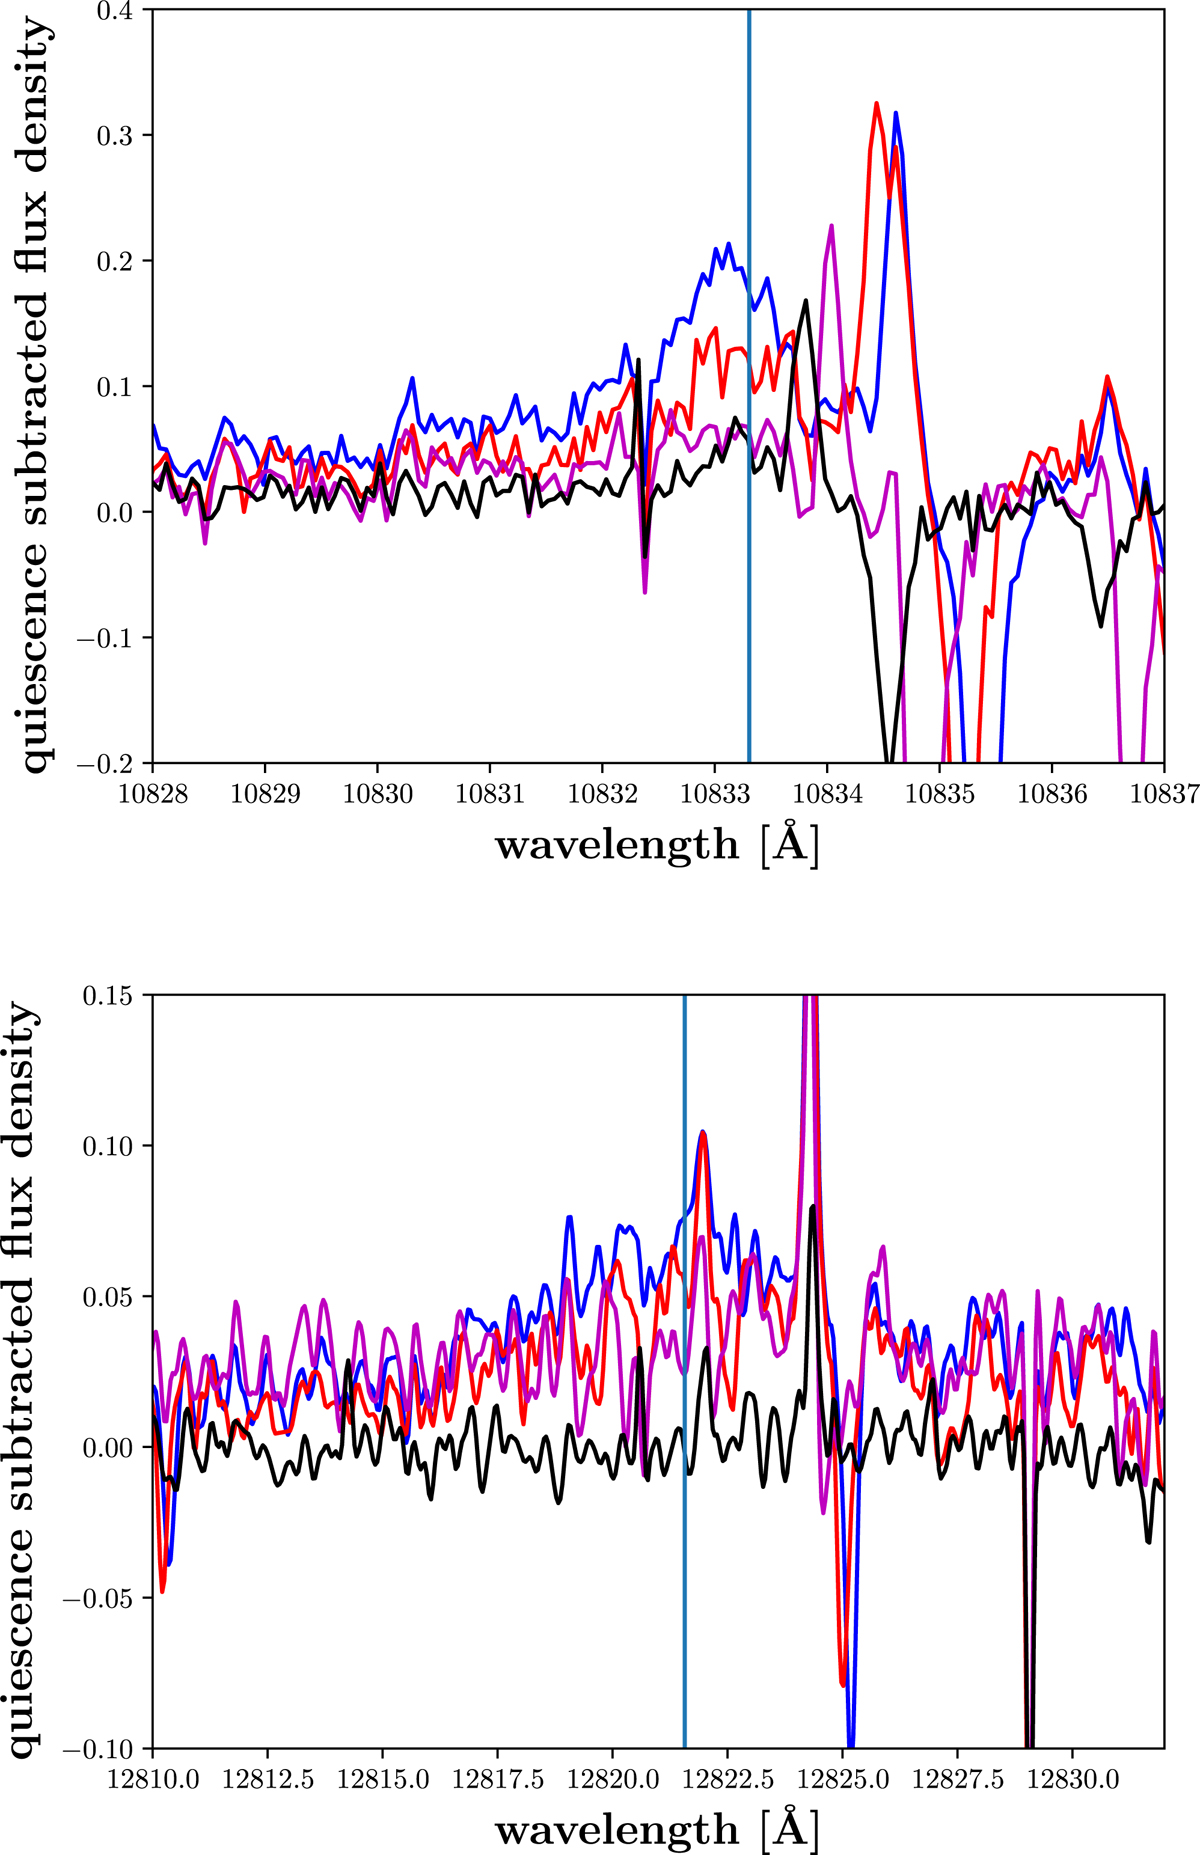
Line asymmetries in infrared spectra of EV Lac. Top: The quiescence subtracted He I 10 833 Å line profile. Bottom: The quiescence subtracted Paβ line profiles smoothed over eight bins for reduction of noise. The colours indicate different active spectra of EV Lac but correspond to the same spectra for both lines. In both cases the reference central wavelength is marked by the blue vertical line.
Current usage metrics show cumulative count of Article Views (full-text article views including HTML views, PDF and ePub downloads, according to the available data) and Abstracts Views on Vision4Press platform.
Data correspond to usage on the plateform after 2015. The current usage metrics is available 48-96 hours after online publication and is updated daily on week days.
Initial download of the metrics may take a while.