Free Access
Fig. 13.
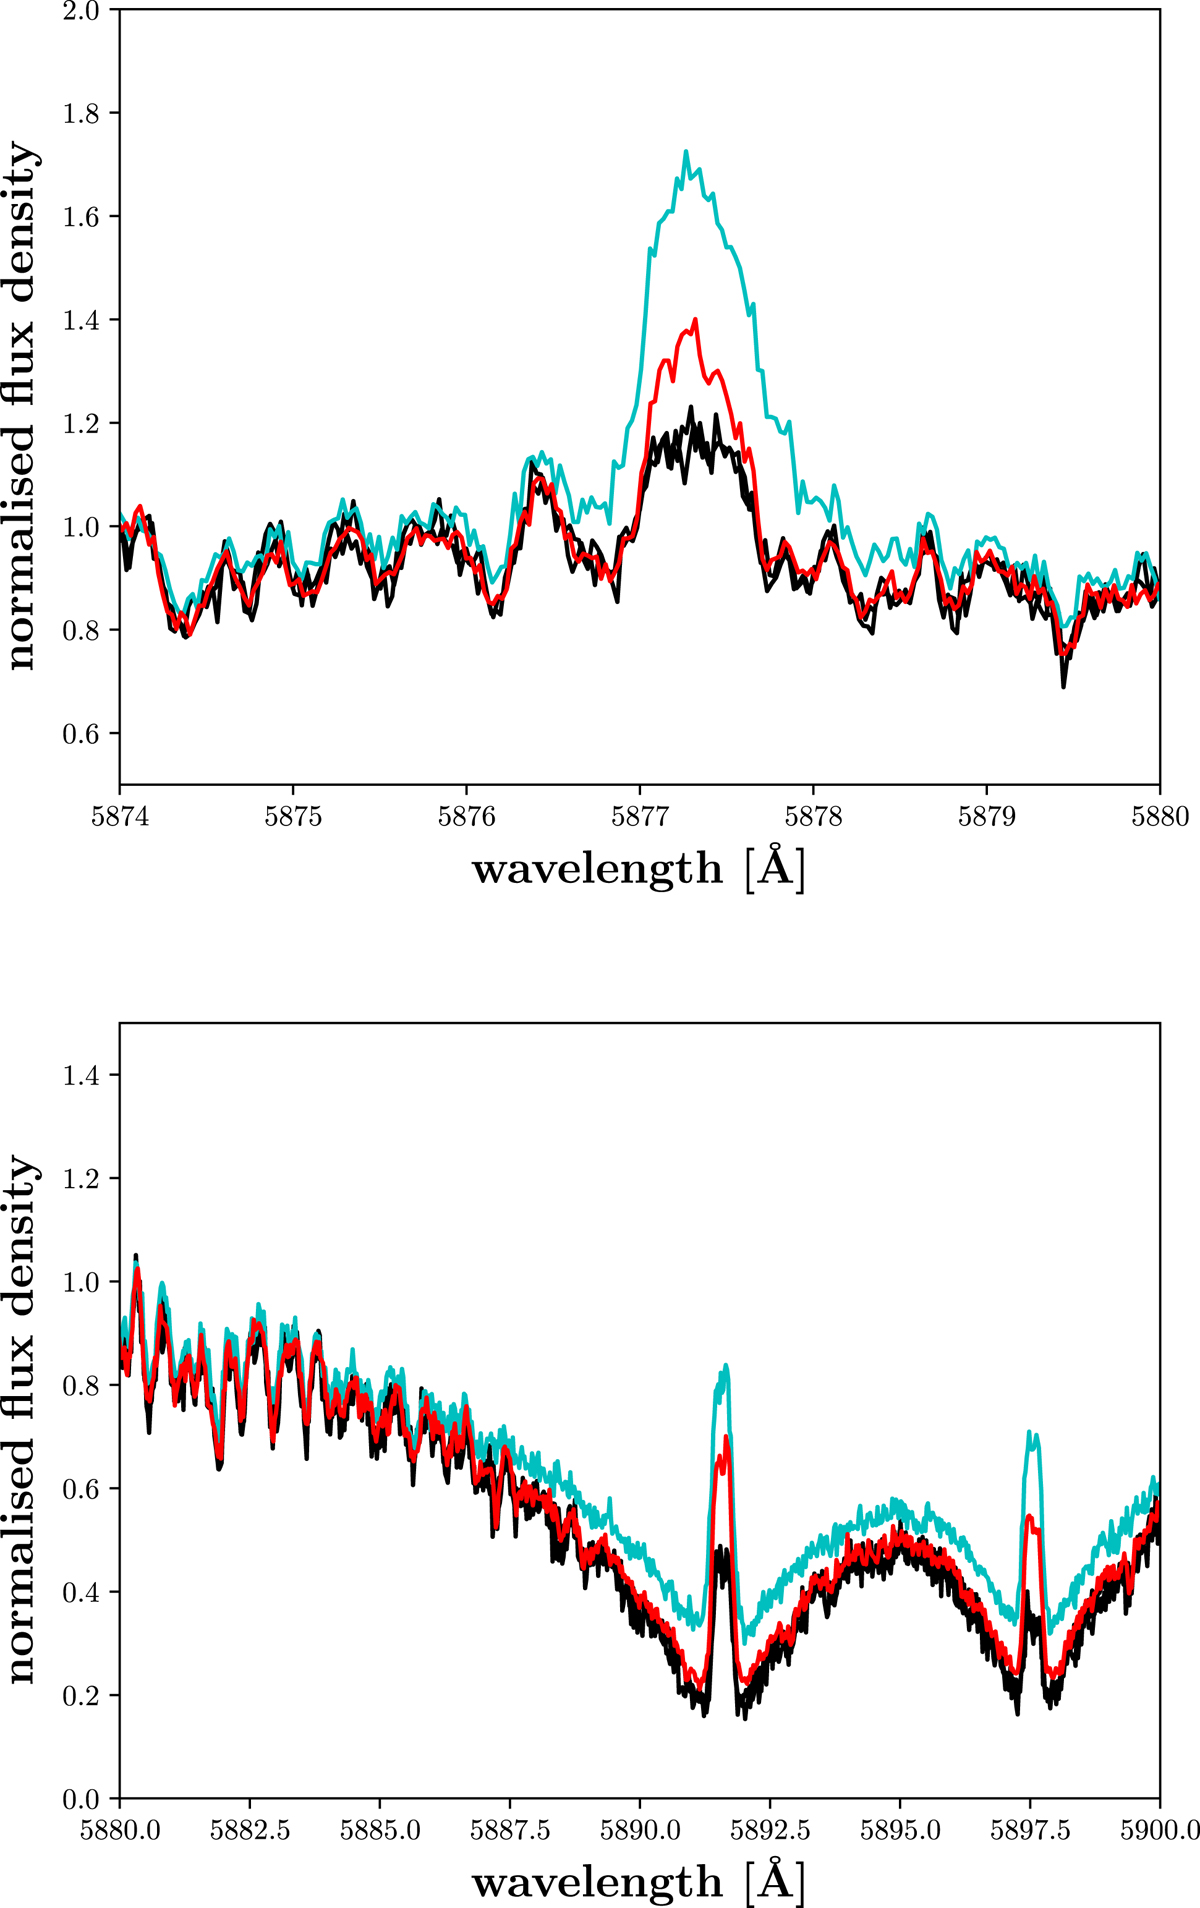
Line asymmetries in spectra of OT Ser. Normalised He I D3 (top) and Na I D line profiles (bottom). In both cases, we show two typical quiescent spectra in black along with two spectra of enhanced activity in cyan and red (same spectra and colour coding as in Fig. 3).
Current usage metrics show cumulative count of Article Views (full-text article views including HTML views, PDF and ePub downloads, according to the available data) and Abstracts Views on Vision4Press platform.
Data correspond to usage on the plateform after 2015. The current usage metrics is available 48-96 hours after online publication and is updated daily on week days.
Initial download of the metrics may take a while.