Free Access
Fig. 10.
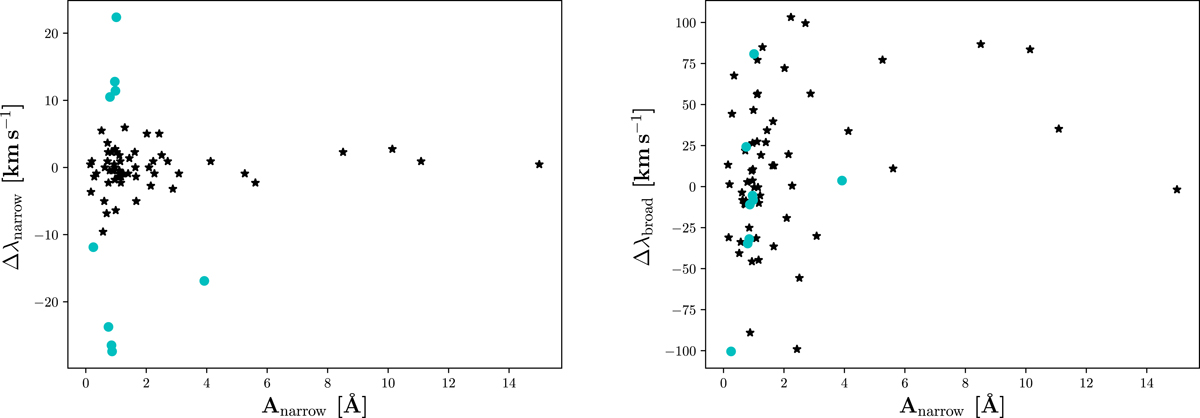
Shift of narrow (left panel) and broad (right panel) Gaussian component as a function of their continuum-normalised residual flux density (measured by the Gaussian area A of the residual line fit). Cyan dots mark outliers showing absolute shifts exceeding 10 km s−1 in the narrow component.
Current usage metrics show cumulative count of Article Views (full-text article views including HTML views, PDF and ePub downloads, according to the available data) and Abstracts Views on Vision4Press platform.
Data correspond to usage on the plateform after 2015. The current usage metrics is available 48-96 hours after online publication and is updated daily on week days.
Initial download of the metrics may take a while.