Fig. 7
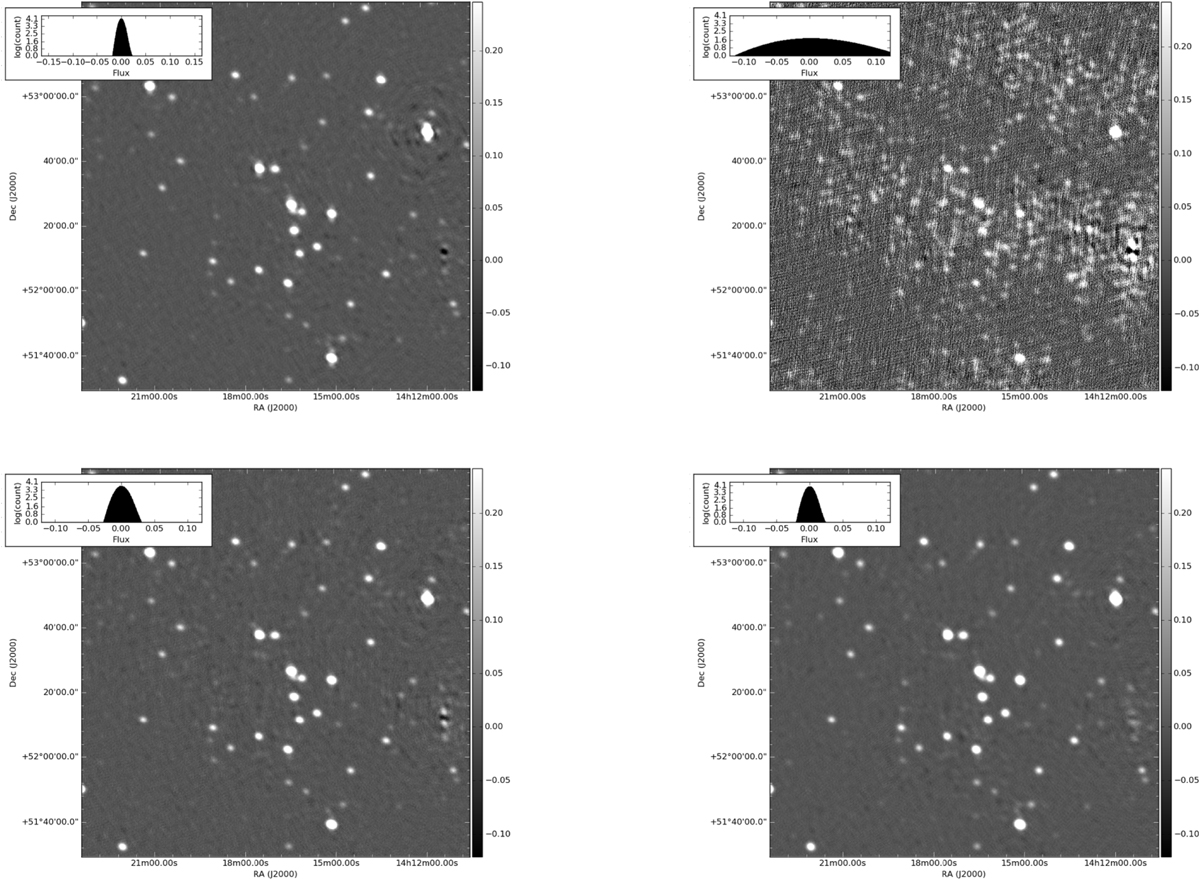
Restored images of the centre of the Extended Groth Strip, as seen with an eight-hour observation using the full LOFAR array. Panel a: shows an image of the field made with good calibration intervals; well-calibrated, un-weighted restored image of the sky near the centre of the Extended Groth Strip. Used for comparison with the other images. Units of colour bar are Janskys. This image was made with data calibrated following best practice (solution intervals of 8 s, half the bandwidth). rms = 5.87 mJy beam−1. Panel b:shows an image of the field made with poor calibration intervals; poorly-calibrated, un-weighted restored image of the sky near the centre of the Extended Groth Strip. Units of colour bar are Janskys. This image was made with the same data as for panel a, but averaged in time and calibrated using larger gain solution intervals: two minutes and half the bandwidth. rms = 86.4 mJy beam−1. Panel c: shows image made with the same visibilities and imaging parameters, but with the application of the sensitivity-optimal weighting scheme; image made using the same imaging parameters and corrected visibilities as panel b, using sensitivity-optimal weighting. Units of colour bar are Janskys. rms = 9.69 mJy beam−1. Panel d: similarly, differs from panel c only in that artefact-optimal weights, rather than sensitivity-optimal weights, were used; image made using the same imaging parameters and corrected visibilities as panel b, using artefact-optimal weighting. Units of colour bar are Janskys. rms = 15.8 mJy beam−1. The histograms of pixel values in each image have 1000 flux bins ranging from –0.16 Jy to 0.16 Jy. Their ordinates are in log scale. Pixel size is 1.5′′ in all images.
Current usage metrics show cumulative count of Article Views (full-text article views including HTML views, PDF and ePub downloads, according to the available data) and Abstracts Views on Vision4Press platform.
Data correspond to usage on the plateform after 2015. The current usage metrics is available 48-96 hours after online publication and is updated daily on week days.
Initial download of the metrics may take a while.