Open Access
Fig. 1
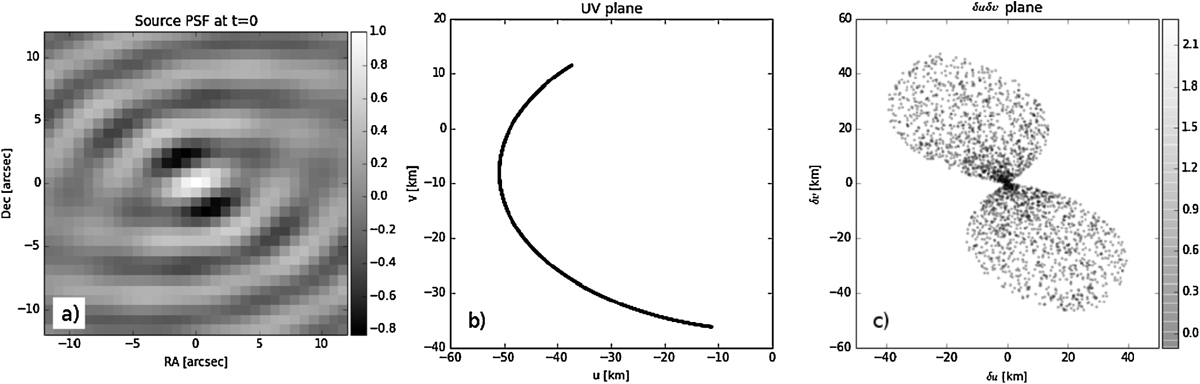
Panel a: PSF image of a simulated 1Jy source at phase centre. Colour-bar units are in Jansky. Panel b: associated UV track, panel c: the corresponding ![]() tracks. The δuδv plane does not have a homogeneous point density, but is denser near its origin: here, this is shown by plotting only one random point in 10 000.
tracks. The δuδv plane does not have a homogeneous point density, but is denser near its origin: here, this is shown by plotting only one random point in 10 000.
Current usage metrics show cumulative count of Article Views (full-text article views including HTML views, PDF and ePub downloads, according to the available data) and Abstracts Views on Vision4Press platform.
Data correspond to usage on the plateform after 2015. The current usage metrics is available 48-96 hours after online publication and is updated daily on week days.
Initial download of the metrics may take a while.