Fig. 3.
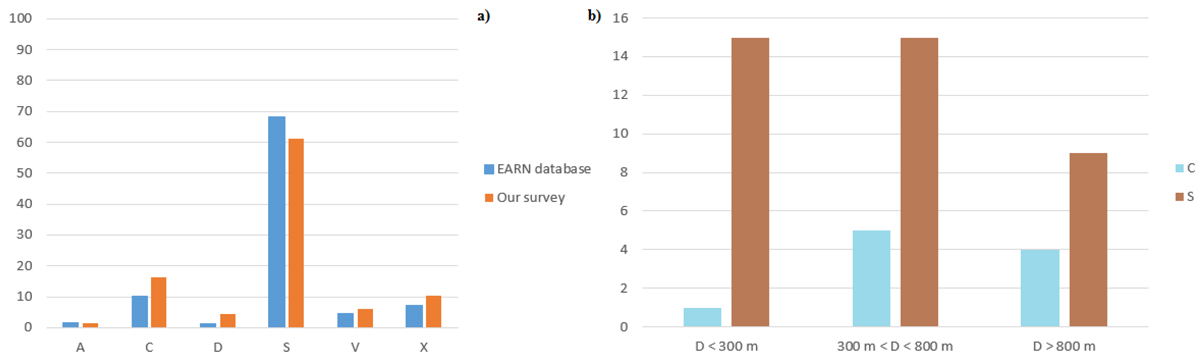
Panel a: percentage distribution of the taxonomic complexes and classes in our survey compared to those reported in the EARN database (www.earn.dlr.de/nea/table1_new.html). Panel b: the distribution of C- and S-complex objects classified in our survey in three different size ranges: D < 300 m, 300 m < D < 800 m, and D > 800 m.
Current usage metrics show cumulative count of Article Views (full-text article views including HTML views, PDF and ePub downloads, according to the available data) and Abstracts Views on Vision4Press platform.
Data correspond to usage on the plateform after 2015. The current usage metrics is available 48-96 hours after online publication and is updated daily on week days.
Initial download of the metrics may take a while.