Fig. 4
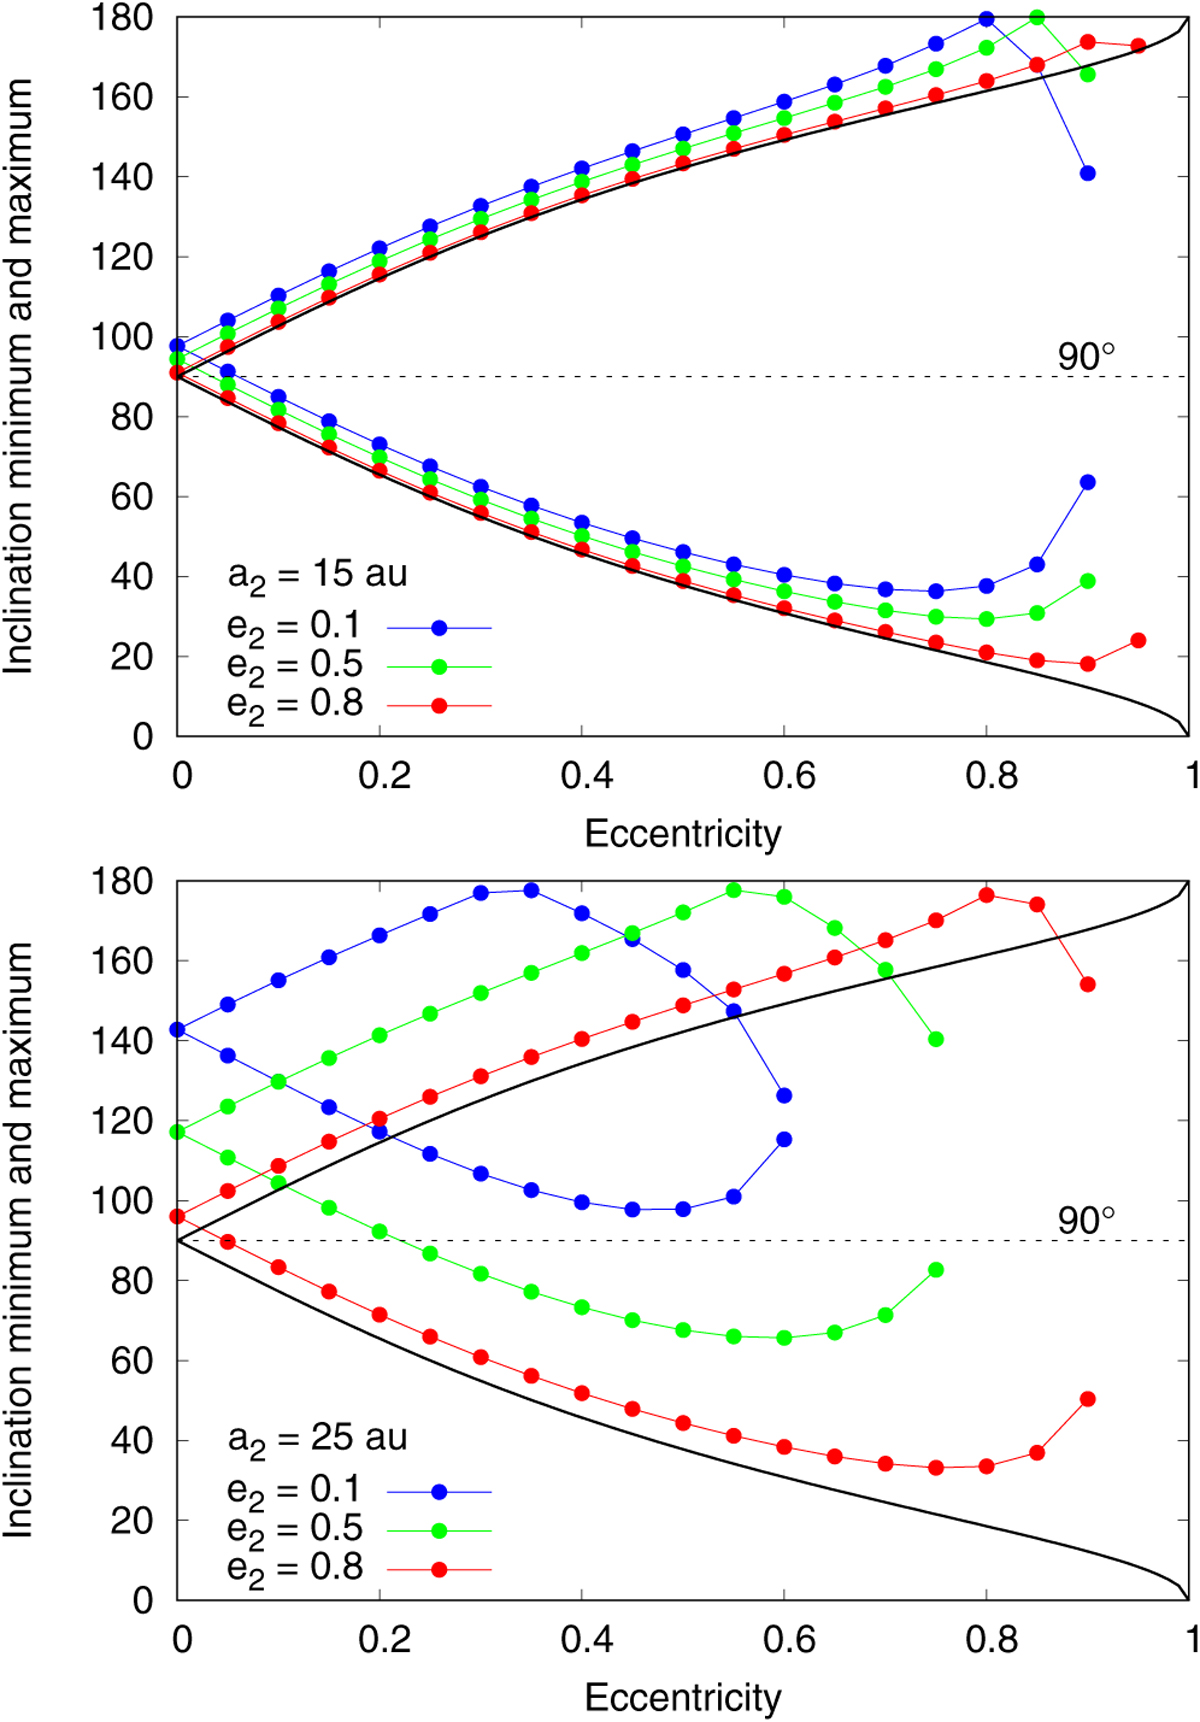
Minimum and maximum inclination allowed for libration trajectories as a function of the eccentricity of the planet. The black curves represent the correlation in absence of GR. The blue, green, and red curves in both panels show the extreme values of the inclination for eccentricity e2 of 0.1, 0.5, and 0.8, respectively, when the GR effects are included. Moreover, we adopt a particle’s semimajor axis a2 of 15 au and 25 au in the top and bottom panels, respectively. Finally, we consider a semimajor axis a1 = 1 au for the planet in both panels.
Current usage metrics show cumulative count of Article Views (full-text article views including HTML views, PDF and ePub downloads, according to the available data) and Abstracts Views on Vision4Press platform.
Data correspond to usage on the plateform after 2015. The current usage metrics is available 48-96 hours after online publication and is updated daily on week days.
Initial download of the metrics may take a while.