Fig. 10
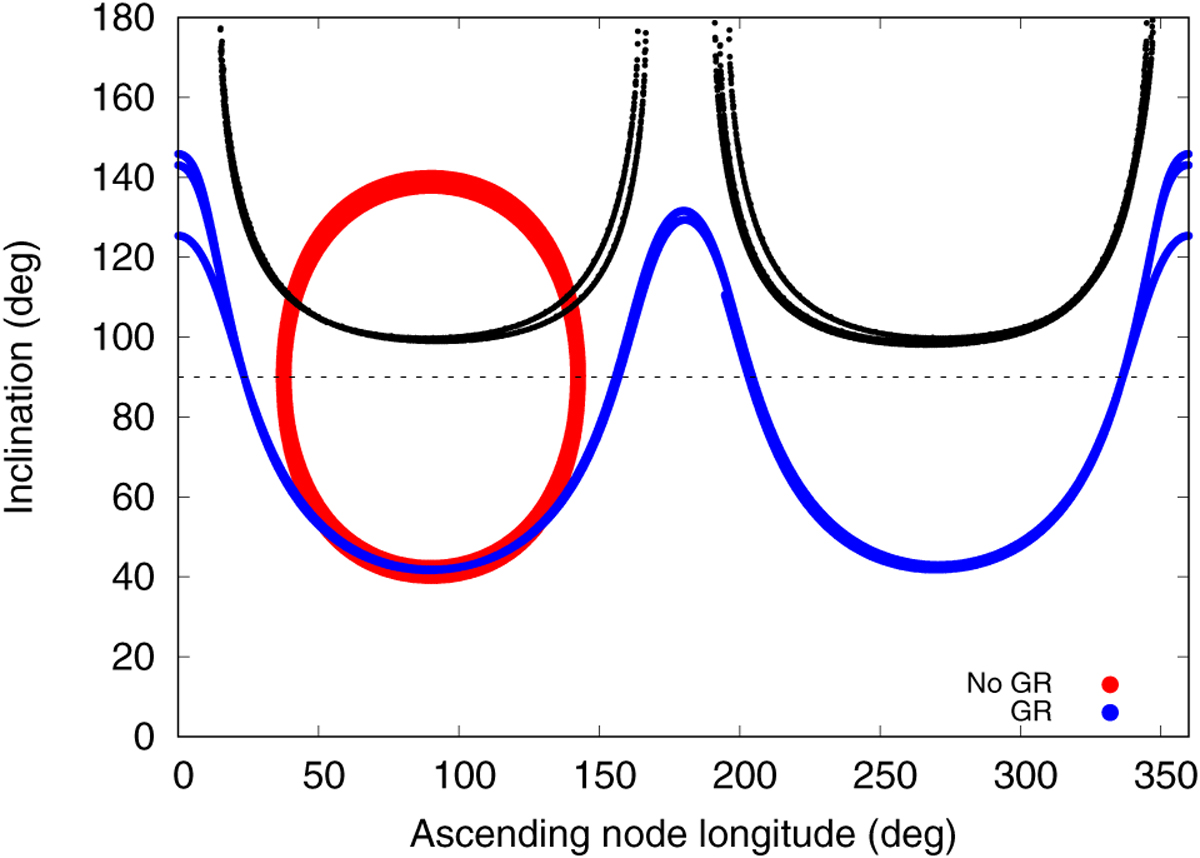
Evolution of the inclination i2 and ascending node longitude Ω2 of a given particle resulting from the No-GR (red curve) and GR simulations (blue curve). The black dots illustrate the values of the particle’s inclination i2 for which the ascending node longitude reaches extreme values given by Eq. (7). The horizontal dashed black line represents a value of the inclination i2 of 90°. The planet of the system has a semimajor axis a1 of 0.867 au and an eccentricity e1 of 0.8. The initial conditions of the particle are a2 = 20.792 au, e2 = 0.705, i2 = 51.09°, ω2 = 157.95°, and Ω2 = 52.9°.
Current usage metrics show cumulative count of Article Views (full-text article views including HTML views, PDF and ePub downloads, according to the available data) and Abstracts Views on Vision4Press platform.
Data correspond to usage on the plateform after 2015. The current usage metrics is available 48-96 hours after online publication and is updated daily on week days.
Initial download of the metrics may take a while.