Fig. A.1
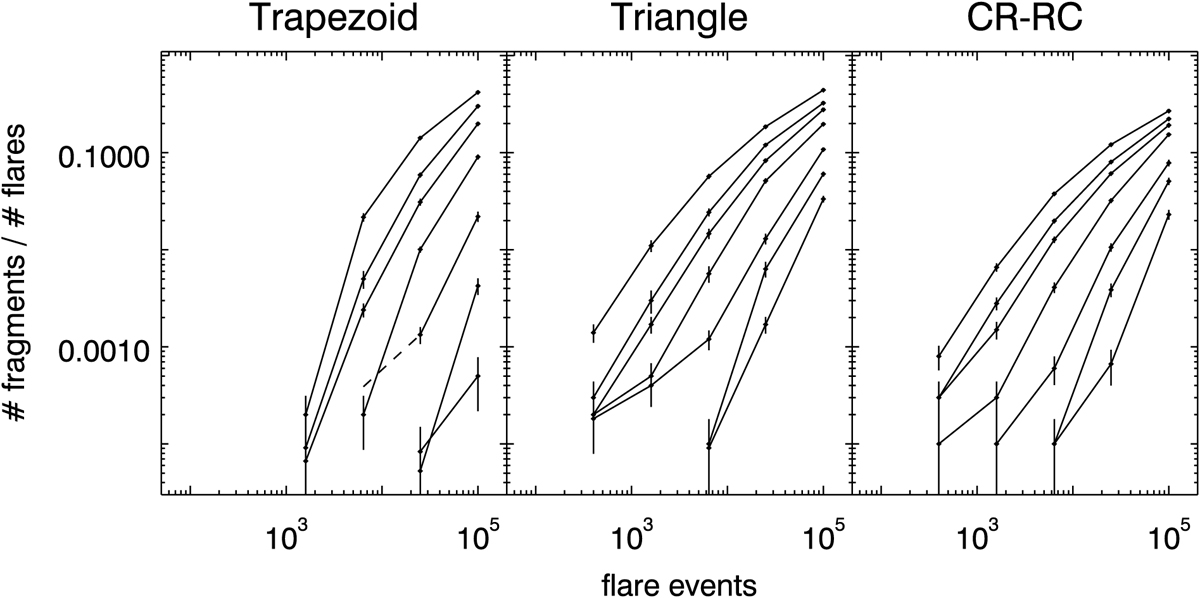
Frequency of Fragmentation artifact as a function of the events collected during the flaring period. The three panels are for the following temporal shapes: trapezoidal (left panel), triangular (central panel), temporal shape described in Eq. (9) (right panel). The clustering scheme of Eq. (2) is used. Continuous lines are used to connect the evaluated frequencies for the same tolerance parameter. Dashed lines are used to connect evaluated frequency to upper limits (99.87% c.l.). From top to bottom curves, tolerance parameters is set to 1, 3, 5, 10, 25, 50, 100.
Current usage metrics show cumulative count of Article Views (full-text article views including HTML views, PDF and ePub downloads, according to the available data) and Abstracts Views on Vision4Press platform.
Data correspond to usage on the plateform after 2015. The current usage metrics is available 48-96 hours after online publication and is updated daily on week days.
Initial download of the metrics may take a while.