Fig. 7
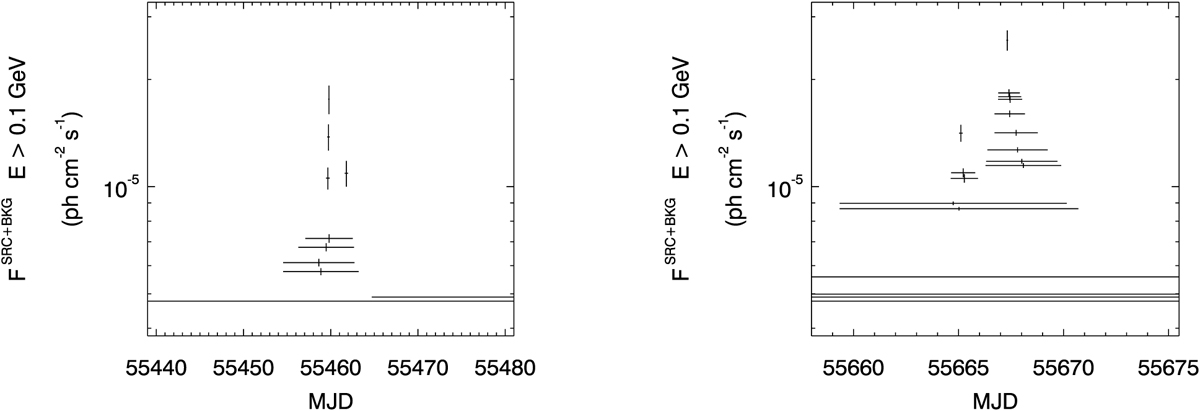
Unbinned light curve for the Crab Nebula, obtained with Ntol = 50, E > 0.1 GeV, extraction radius corresponding to the containment of 68% of photons from the source. Confidence level is 99.87%. The unbinned light curve is produced for 7.25 yr, but only two already studied periods are shown for a direct comparison of the results: left panel reports the observing period investigated in Striani et al. (2013) and in Abdo et al. (2011a). Right panel reports the observing period investigated in Buehler et al. (2012). Each horizontal segment represents a cluster: it subtends the temporal interval characterizing the cluster; its length is the length of the cluster in the temporal domain; its height is the mean photometric flux of the source within the subtended temporal interval. The unbinned light curve as a whole is a representation of a single-root tree like hierarchy. The bottom segment is the root cluster. Ascending the tree corresponds to go from the bottom up of the plotted diagram of clusters. For each cluster, a parent can be identified (the boundaries of a son cluster are within the boundaries of the parent). All the reported clusters which can be regarded as parents do not describe flat activity periods (the hypothesis that the events within a parent cluster are uniformly distributed is rejected with a confidence level of 99.87%). Clusters and chain of clusters are expected for flaring periods, when the hypothesis of uniformly distributed events is false. Leaves are the activity peaks. Every son cluster is statistically relevant with respect to its parent, according to the chosen confidence level. Therefore the unbinned light curve is a statistically filtered representation of the source activity.
Current usage metrics show cumulative count of Article Views (full-text article views including HTML views, PDF and ePub downloads, according to the available data) and Abstracts Views on Vision4Press platform.
Data correspond to usage on the plateform after 2015. The current usage metrics is available 48-96 hours after online publication and is updated daily on week days.
Initial download of the metrics may take a while.