Fig. 6
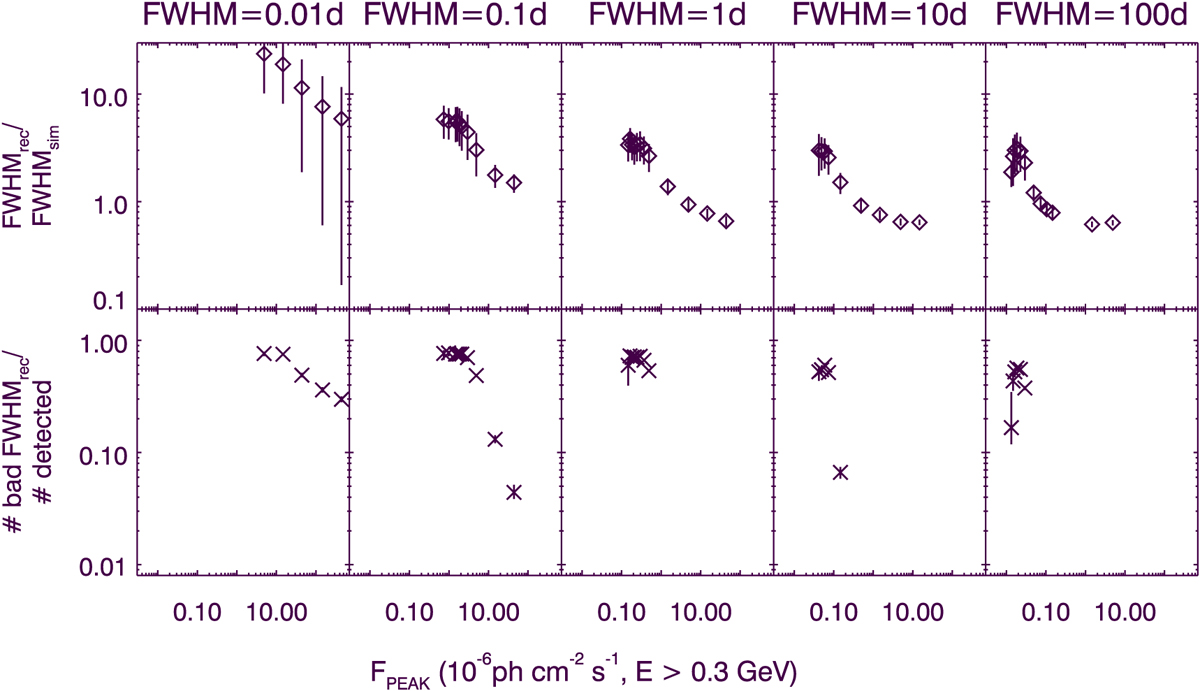
Temporal FWHM reconstruction capability. Top panels: mean (open diamonds) and standard deviation (vertical lines) of the reconstructed FWHM (normalized to the simulated FWHM) as a function of the peak flux for different values of the FWHM. Bottom panels: number of flares (normalized to the number of detected flares) for which the reconstructed temporal FWHM is below a factor of
![]() of the simulated value (diamonds), or above a factor of 2 of the simulated value (crosses). Where values are not reported in bottom panels, upper limits of 6.6 (with 99.87% c.l.) must be considered.
of the simulated value (diamonds), or above a factor of 2 of the simulated value (crosses). Where values are not reported in bottom panels, upper limits of 6.6 (with 99.87% c.l.) must be considered.
Current usage metrics show cumulative count of Article Views (full-text article views including HTML views, PDF and ePub downloads, according to the available data) and Abstracts Views on Vision4Press platform.
Data correspond to usage on the plateform after 2015. The current usage metrics is available 48-96 hours after online publication and is updated daily on week days.
Initial download of the metrics may take a while.