Fig. 4
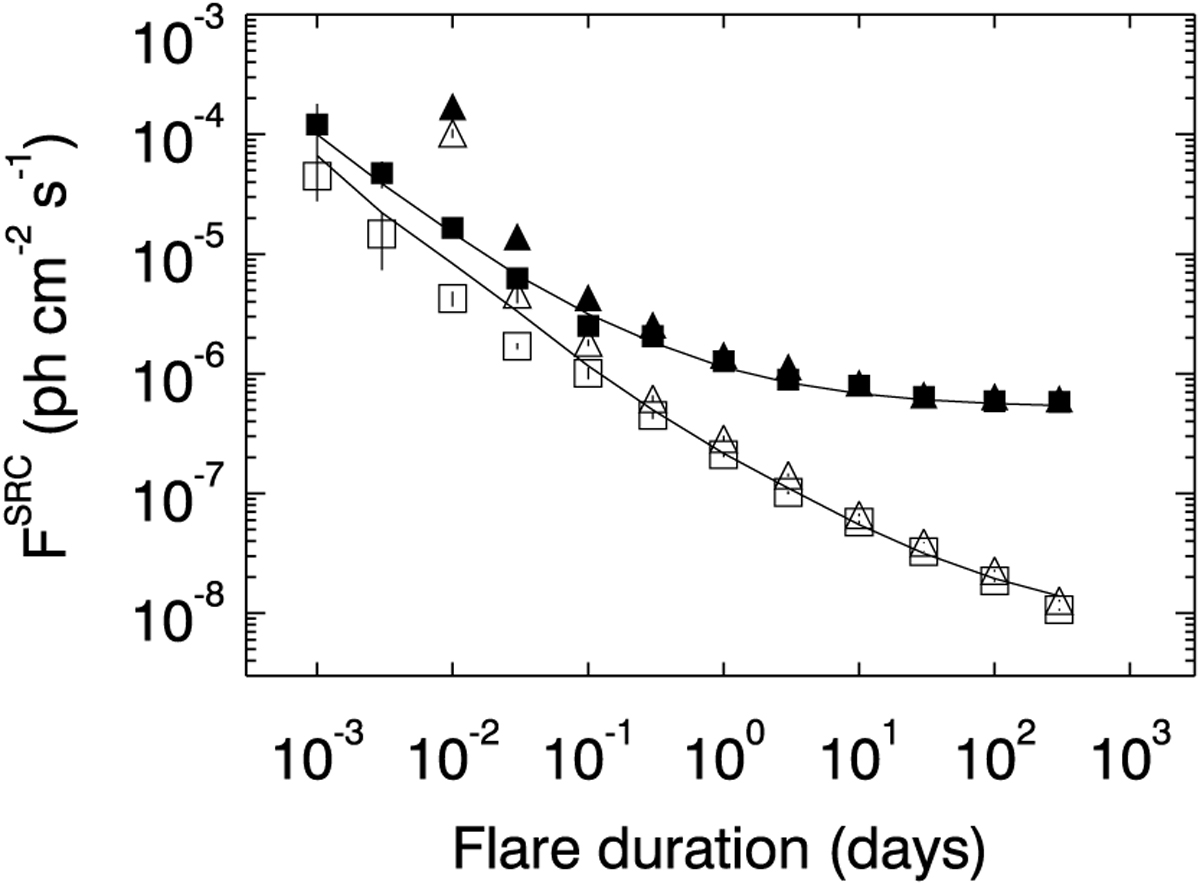
Peak flux detection threshold as a function of the simulated flare duration, reported as FWHM. Triangles (squares): flux threshold is defined as the peak flux for which half (20%) of the simulated flares are detected. The observing period is 7.25 yr, E > 0.3 GeV. The extraction radius corresponds to the containment radius for 68% of events. Open squares and triangles refers to a faint source (giving a total number of counts on Fermi-LAT that is 20% of the background counts within the scrutinized period). Filled symbols refer to a bright source (corresponding to the case of 3C 454.3). Curves refer to sensitivities calculated assuming constant exposure, hat shaped flares, for
![]() (e.g. 99.87%c.l.).
(e.g. 99.87%c.l.).
Current usage metrics show cumulative count of Article Views (full-text article views including HTML views, PDF and ePub downloads, according to the available data) and Abstracts Views on Vision4Press platform.
Data correspond to usage on the plateform after 2015. The current usage metrics is available 48-96 hours after online publication and is updated daily on week days.
Initial download of the metrics may take a while.