Fig. B.1
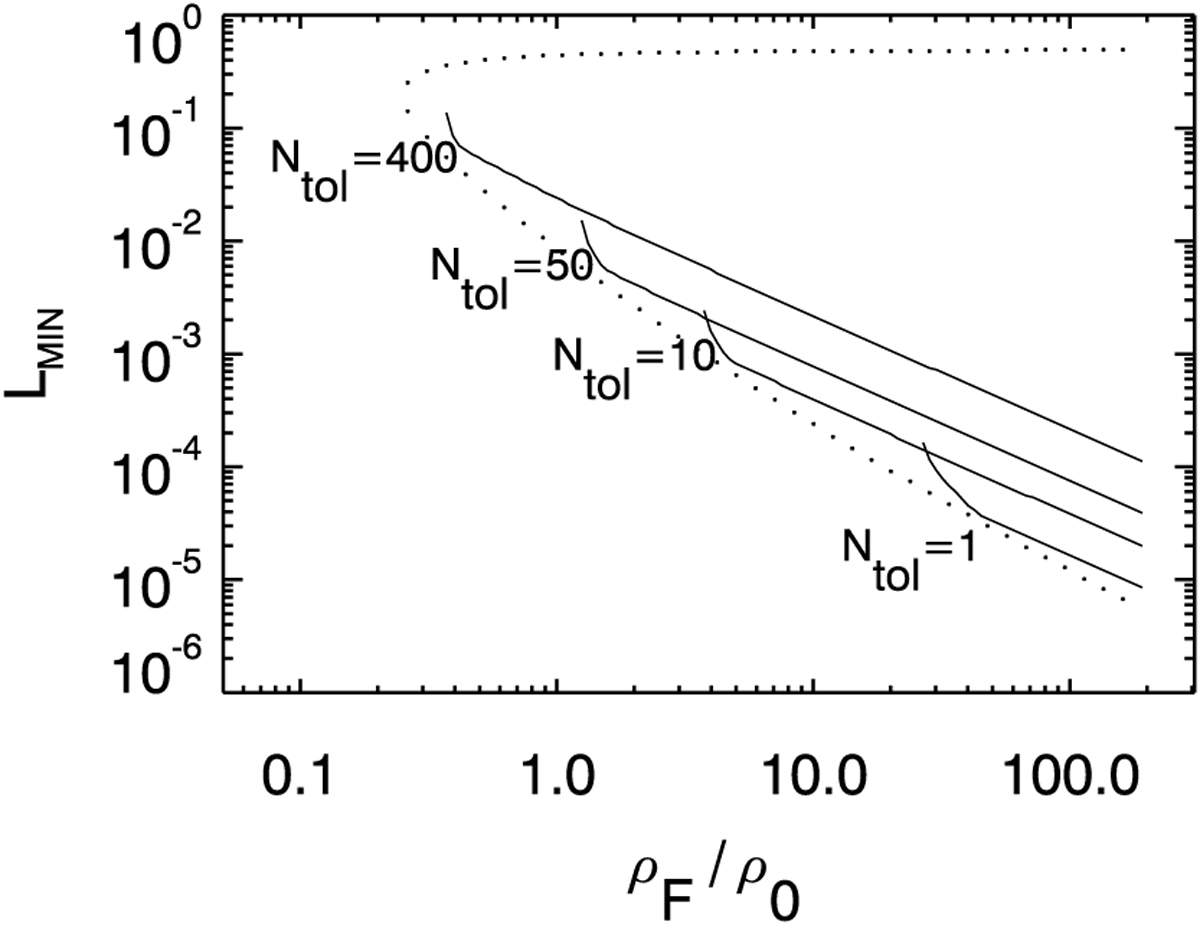
Resolving power capability for various Ntol parameters. Computation refers to two identical box-shaped flares: L is the width of each flare, ρF is the event density of the flare, and ρ0 is the background event density. There are Ntol background events in between the two flares. The continuous curves represent the minimum flare width for which the two contiguous flares are resolved. The dotted curve is the sensitivity limit (99.87% c.l.) for two identical box-shaped flares. For any given
![]() two identical flares of length lower than the computed values are not resolved.
two identical flares of length lower than the computed values are not resolved.
Current usage metrics show cumulative count of Article Views (full-text article views including HTML views, PDF and ePub downloads, according to the available data) and Abstracts Views on Vision4Press platform.
Data correspond to usage on the plateform after 2015. The current usage metrics is available 48-96 hours after online publication and is updated daily on week days.
Initial download of the metrics may take a while.