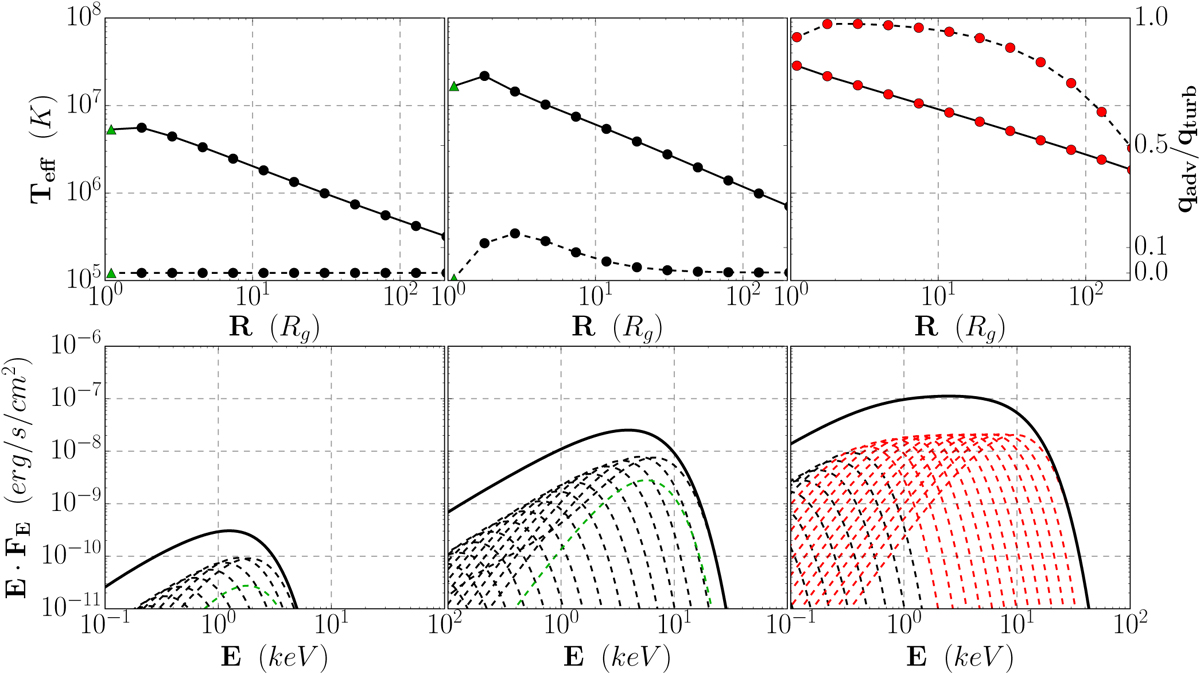
Fig. B.3

SAD configurations, settled from rin = 1 with αv= 0.1, fed with an increasing ṁinfrom left to right: 0.01, 1, 100. Top panels: disk effective temperature Teff (solid lines) and ratio qadv∕qturb (dashed lines). Bottom panels: associated disk spectra. The dashed lines are the spectra emitted from each disk annulus whereas the solid black lines are the total integrated spectrum. A red color (in dots and spectra) describes annuli dominated by advection, whereas a green color (triangles and spectra) describes a negative advection term (see text).
Current usage metrics show cumulative count of Article Views (full-text article views including HTML views, PDF and ePub downloads, according to the available data) and Abstracts Views on Vision4Press platform.
Data correspond to usage on the plateform after 2015. The current usage metrics is available 48-96 hours after online publication and is updated daily on week days.
Initial download of the metrics may take a while.


