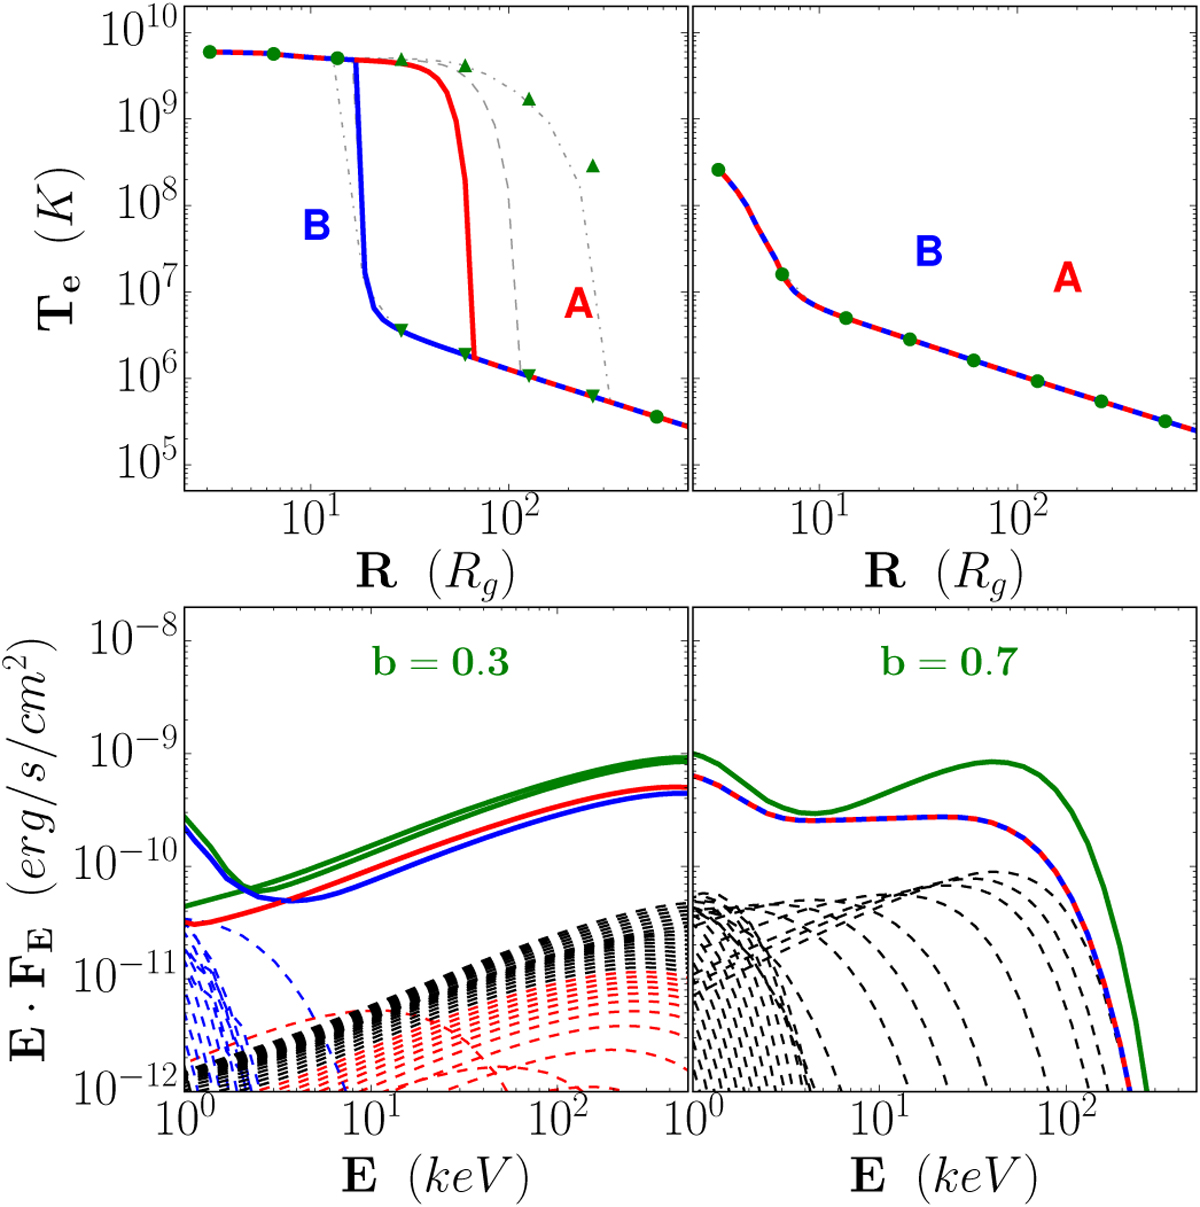
Fig. A.3

Resolution effect on the radial thermal structure (top) and the global SED (bottom) for two values of the jet power fraction b. This figure is similar to Fig. 5, which has been computed using N = 15 and is reported here as green markers (top) and green solid lines (bottom). The results obtained for N = 40 and 70 are shown as dot-dashed and dashed gray lines in the top panel, respectively. The colors show solutions for N = 100.
Current usage metrics show cumulative count of Article Views (full-text article views including HTML views, PDF and ePub downloads, according to the available data) and Abstracts Views on Vision4Press platform.
Data correspond to usage on the plateform after 2015. The current usage metrics is available 48-96 hours after online publication and is updated daily on week days.
Initial download of the metrics may take a while.


