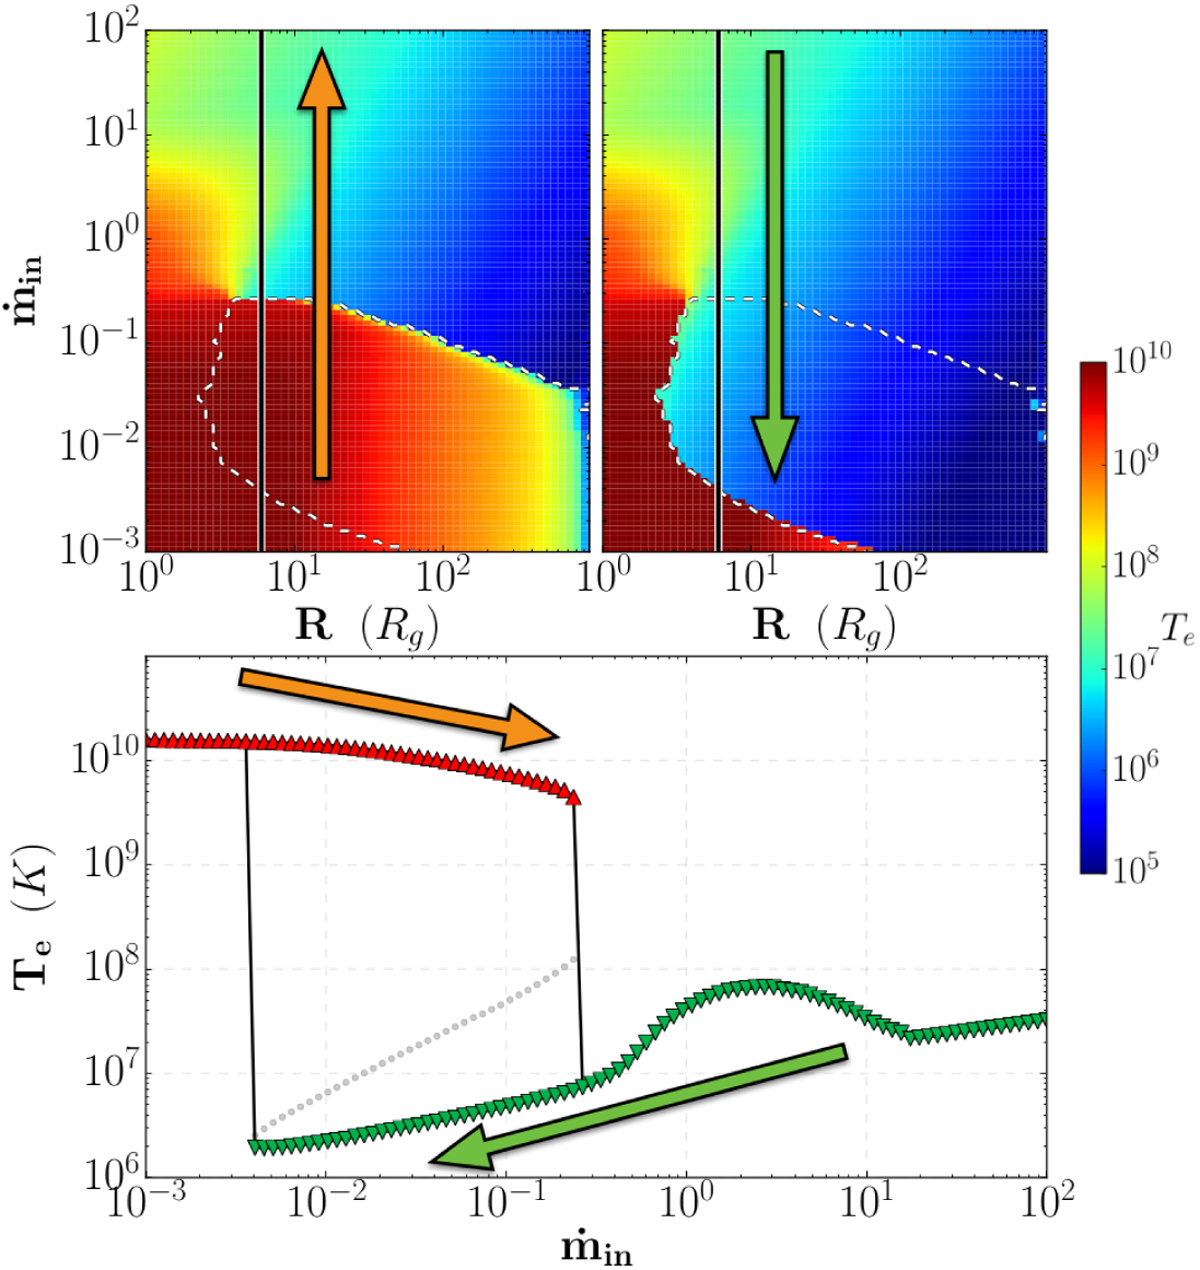
Fig. 11

Top: JED (ṁin − r) solution plane for (μ = 0.1, ξ = 0.01, ms = 1.5, b = 0.7). The background color shows the electron temperature (see colorbar in Kelvin on the right side) for the hottest solution (left) and the coolest solution (right). The dashed white line outlines the zone where these two thermally stable solutions coexist. The slice at r = 5 (vertical solid line) shows the two solutions as function of ṁin, shown in the bottom panel (a version of the S-curve). The red upper triangles show the thick/hot disk solution, and green lower-triangles represent the thin/slim cooler disk. The third, thermally unstable solution is shown as gray dots. The arrows describe a possible hysteresis cycle (see text).
Current usage metrics show cumulative count of Article Views (full-text article views including HTML views, PDF and ePub downloads, according to the available data) and Abstracts Views on Vision4Press platform.
Data correspond to usage on the plateform after 2015. The current usage metrics is available 48-96 hours after online publication and is updated daily on week days.
Initial download of the metrics may take a while.


