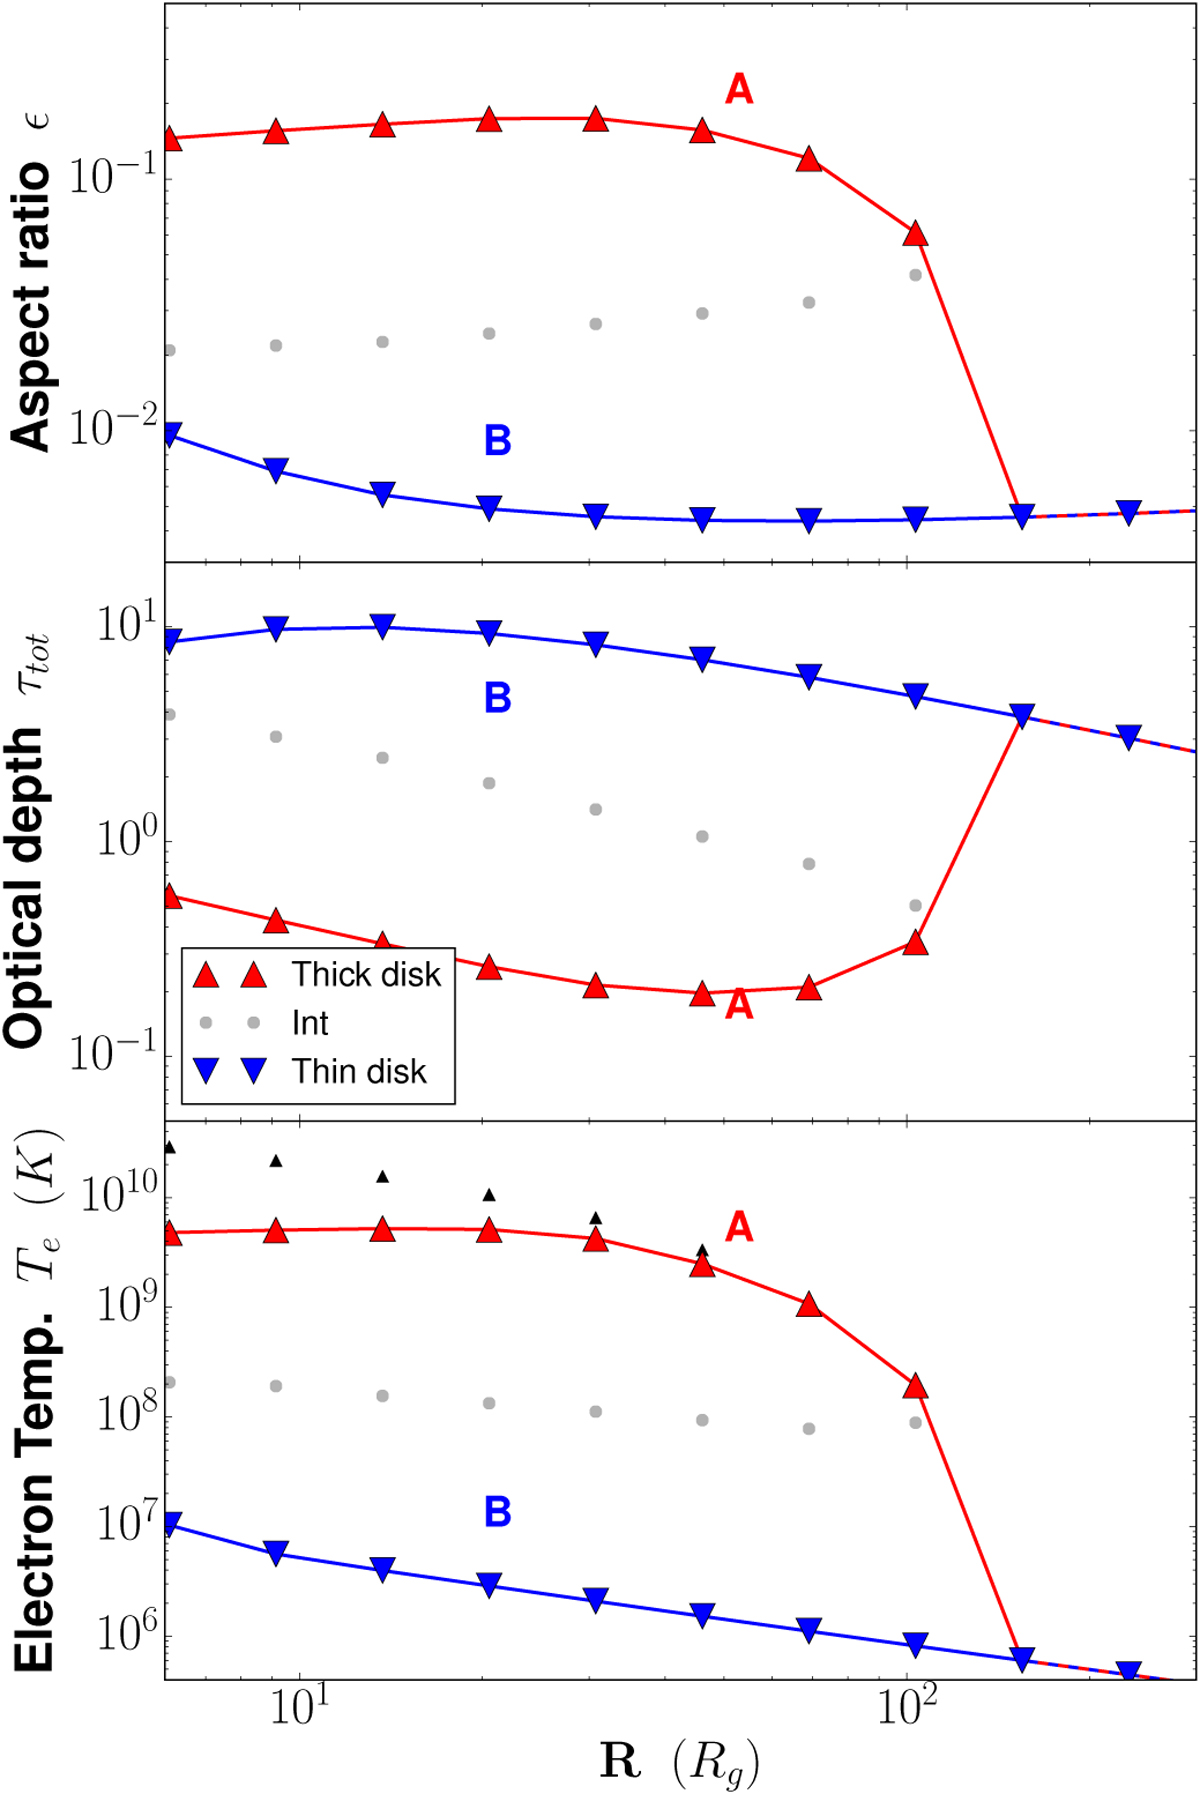
Fig. 1

JED configuration with ṁin = 0.3 and (μ = 0.1, ξ = 0.02, ms = 1.5, b = 0.7). The top panel shows the disk aspect ratio ε = h∕r, the middle panel presents the total optical depth τtot, and the bottom panel shows the electron temperature Te in K. The temperature Ti of the ions, when different from that of the electrons, is also shown as black markers. In these three panels, top-oriented triangles indicate the optically thin, geometrically thick (hot) solution, and bottom-oriented triangles indicate optically thick, geometrically thin (cold) solution. When present, the unstable intermediate solution is shown as gray dots. The two possibleJED configurations A and B are defined as the red and blue distributions (see text).
Current usage metrics show cumulative count of Article Views (full-text article views including HTML views, PDF and ePub downloads, according to the available data) and Abstracts Views on Vision4Press platform.
Data correspond to usage on the plateform after 2015. The current usage metrics is available 48-96 hours after online publication and is updated daily on week days.
Initial download of the metrics may take a while.


