Free Access
Fig. B.5
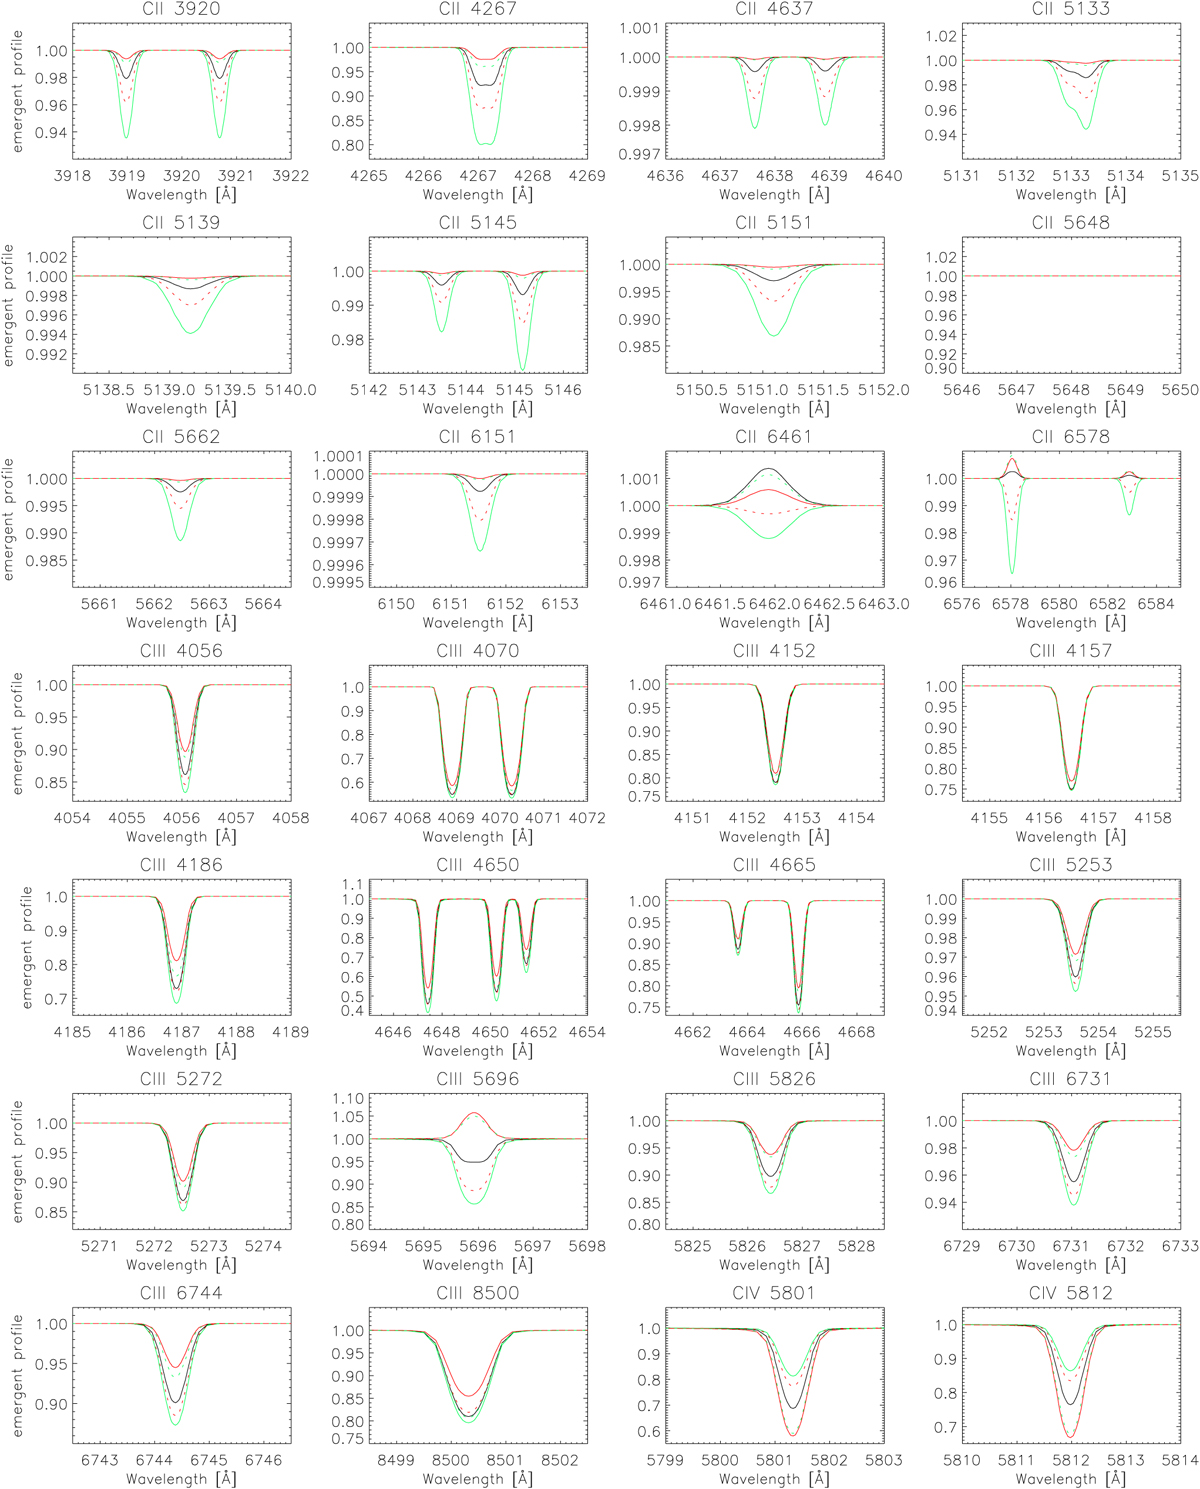
Carbon line profiles for model D35 (black), and dependence on stellar parameters, for our complete set of lines. The red and green solid line profiles correspond to an increase and decrease by 1500 K in Teff, respectively, whereas the red and green dashed profiles correspond to a variation of +0.2 dex and −0.2 dex in log g.
Current usage metrics show cumulative count of Article Views (full-text article views including HTML views, PDF and ePub downloads, according to the available data) and Abstracts Views on Vision4Press platform.
Data correspond to usage on the plateform after 2015. The current usage metrics is available 48-96 hours after online publication and is updated daily on week days.
Initial download of the metrics may take a while.