Fig. B.1
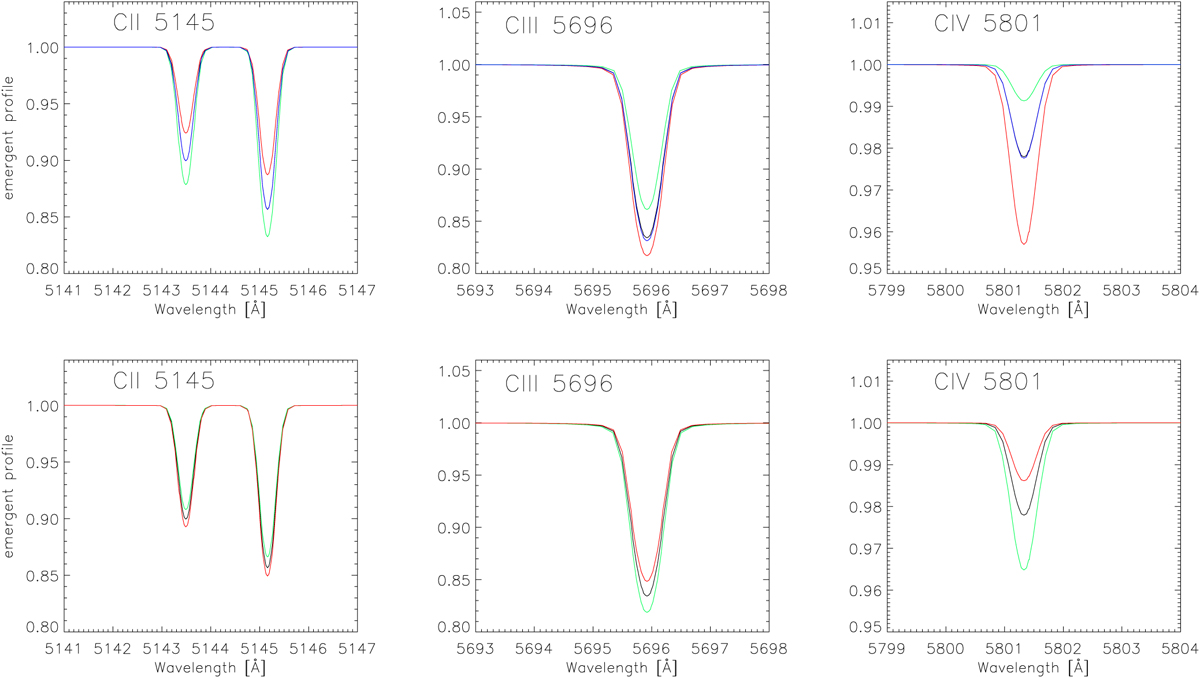
C II 5145, C III 5696, and C IV 5801 line profiles for model D30 (black lines, see Table 2) and similar models with relatively small changes in effective temperature (Teff) and gravity (log g). Upper panels: red lines correspond to a D30 model with Teff increased by 1000 K, the green lines to a model with Teff decreased by the same value, while the blue lines display the reaction to a decrease of Ṁ by a factor of three. Lower panels: red and green lines correspond to a D30 model with log g increased and decreased by 0.15 dex, respectively.
Current usage metrics show cumulative count of Article Views (full-text article views including HTML views, PDF and ePub downloads, according to the available data) and Abstracts Views on Vision4Press platform.
Data correspond to usage on the plateform after 2015. The current usage metrics is available 48-96 hours after online publication and is updated daily on week days.
Initial download of the metrics may take a while.