Free Access
Fig. 7.
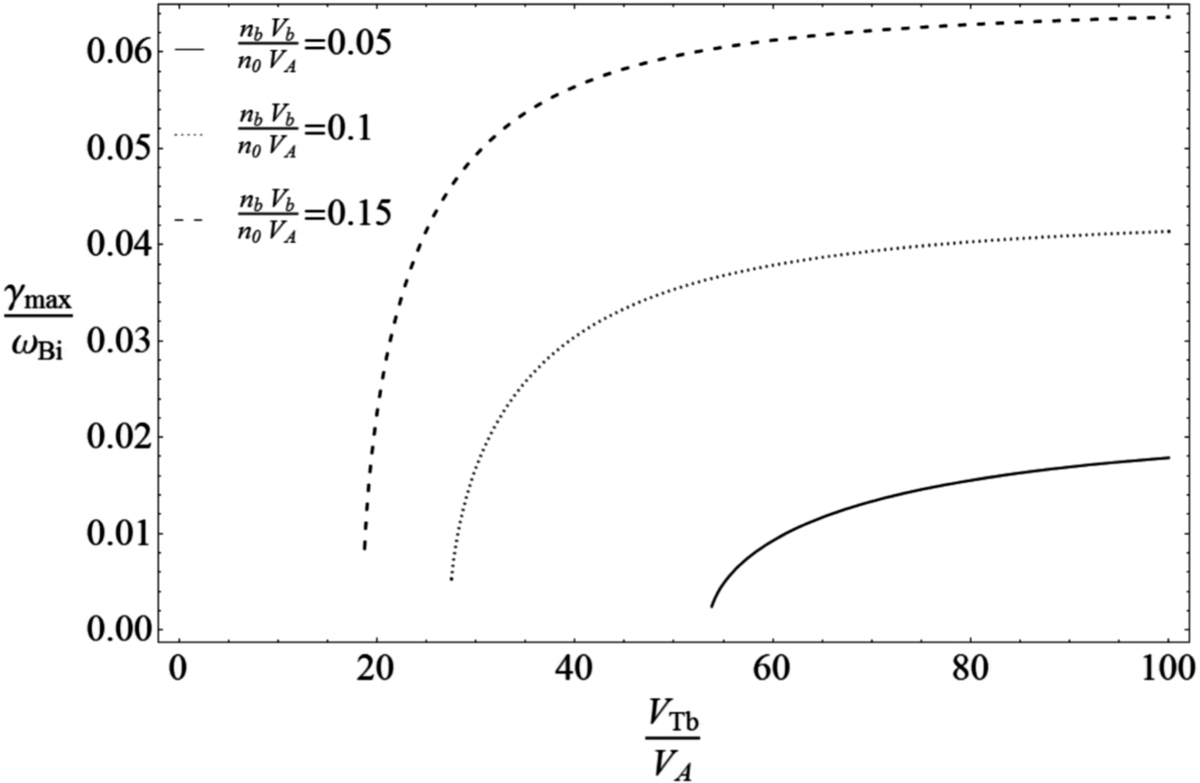
Normalized growth rate γmax/ωBi as a function of VTb/VA for nbVb/ (n0VA) = 0.05 (solid curve), 0.1 (dotted curve), and 0.15 (dashed curve). Starting from zero, the growth rate γmax increases rapidly with VTb, but this increase is quickly saturated. Larger currents nbVb/ (n0VA) result in larger γmax for all VTb.
Current usage metrics show cumulative count of Article Views (full-text article views including HTML views, PDF and ePub downloads, according to the available data) and Abstracts Views on Vision4Press platform.
Data correspond to usage on the plateform after 2015. The current usage metrics is available 48-96 hours after online publication and is updated daily on week days.
Initial download of the metrics may take a while.